Download
1 / 43
430 likes | 439 Views
Real-time integration of simulation, seismic interpretation, and geophysics for the best possible answers. Simulation matches dynamics, geology matches statics and dynamics. Quick results and user-friendly system for data analysis.

E N D
Workflow for Finding Bypassed Reserves in Mature Assets • Real Time Integration of Simulation , Seismic Interpretation, and Geophysics • Best Answers Possible • Simulation matches dynamics • Geology matches statics and dynamics
Reality Today • Integration of Seismic, Geoscience and Reservoir Simulation Almost Never Applied • Not Practical • Work flow in each disciplines historically takes months to years • Answers needed in weeks to months to add value • A good answer on time is better than a perfect answer too late
Data Analysis System Requirements • Easy to Use Windows Based Mapping/Simulation Packages • Designed for all engineers • Not just the expert • Easy integration of geology • Apprentice mapping package • Interpretations for simulator in hours • User friendly simulation analysis system • Merlin - easy to use windows based pre / post processor • Quick results
Mapping Package Features Digitize maps with mouse or tablet
Mapping Package Features Import wizard to import maps from other programs
Mapping Package Features Flexible gridding
Data Analysis System Features PVT/Kr correlations Waterflood pattern models in minutes
Data Analysis System Features Place horizontal and vertical well trajectories with the mouse
Data Analysis System Features Contour maps and cross sections
Data Analysis System Features 3-D fences and fields
Data Analysis System Features Ternary colors
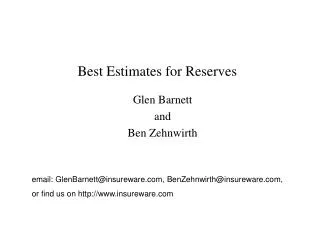
Evaluation of Mature Asset with Quantitative 3-D Seismic Gemini Solutions, Inc..
Objective: in partnership with Energy Outpost assess drilling prospects for the Mature Gulf Of Mexico Prospect
Introduction: 5 major sands investigated: Sand 1, Sand 2, Sand 3, Sand 4, Sand 5 Highly faulted and compartmentalized environment: a total of 52 reservoirs/fault blocks 24 reservoirs/fault blocks with production history and 29 wells/completions A total of 64 independent reservoirs/fault blocks initialized and simulated to arrive at final results.
Introduction (cont.): Reservoir models initialized on the basis of: - structure, gross thickness, net thickness, and porosity maps developed by Energy Outpost - available reservoir data from property/prospects files (PVT, well test, completion data, etc.) - assumption of relative permeability, and permeability All sands simulated on identical 53x46x3 variable size grid
Introduction (cont.): Reservoir history match performed for every fault block with production history, within the focus area. Reservoir history match results resolved with Energy Outpost interpretations (iterative process of model definition and enhancement). Final models used to approximate hydrocarbons in place for prospect areas, and to approximate recovery.
Sand 1 Sand Model Structure Map
Sand 1 Sand Model Net Thickness Map
Sand 1 Sand Model Region Definition Map 1 3 5 2 6 8 7 4
Sand 1 Sand Model Well History Match
Sand 1 Sand Model Saturation map at initialization
1 3 5 2 6 8 7 4 Sand 1 Sand Model Results of modeling 6.4 BCF reserves in compartments 3, 5, 6
Sand 2 Sand Model Structure Map
Sand 2 Sand Model Net Thickness Map
9 10 2 3 11 7 12 1 14 13 4 15 6 8 5 Sand 2 Sand Model Region Definition Map
Sand 2 Sand Model Well history match
Sand 2 Sand Model Oil Saturation map at initialization Simulation Identified Leaking Faults
Sand 2 Sand Model Gas Saturation map at initialization
9 10 3 2 11 12 7 13 14 1 4 15 6 8 5 Sand 2 Sand Model Results of modeling 3.1 BCF reserves in 4 compartments
Sand 3 Sand Model Structure Map
Sand 3 Sand Model Net Thickness Map
2 11 3 5 7 12 9 6 17 10 13 4 1 14 16 15 8 Sand 3 Sand Model Region Definition Map
Sand 3 Sand Model Oil Saturation map at initialization
Sand 3 Sand Model Gas Saturation map at initialization
2 11 3 5 7 9 12 17 6 10 13 4 14 16 1 15 8 Sand 3 Sand Model Results of modeling 11.5 BCF , 2.2 MMBO reserves in 8 compartments
Sand 4 Sand Model Structure Map
Sand 4 Sand Model Net Thickness Map
7 2 6 3 9 8 17 4 10 11 12 16 5 1 13 14 15 Sand 4 Sand Model Region Definition Map
Sand 4 Sand Model Saturation map at initialization
Sand 4 Sand Model Saturation map at initialization
Sand 4 Sand Model Results of modeling 7 2 6 3 9 8 17 4 10 11 16 12 5 14 1 13 15 3.8 BCF , 1.33 MMBO reserves in 5 compartments
Summary of results 27 BCF , 3.8 MMBO new reserves in 5 horizons
Conclusions: • Integration of quick simulation and geoscience interpretations allowed significant new reserves to be identified in a mature asset approaching the economic limit • Neither discipline could have identified all of these reserves • 64 fault compartments • history matched multiple times only in weeks • Maps generated quickly • days to weeks – not months to years