Download
1 / 22
230 likes | 307 Views
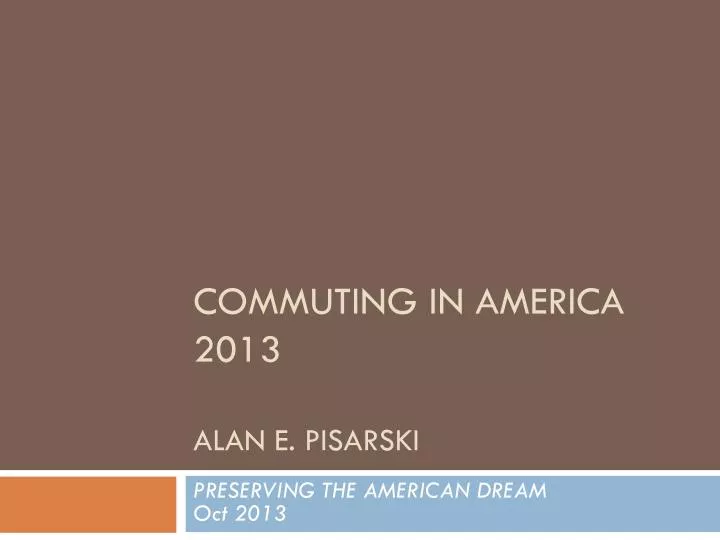
Commuting in America 2013 Alan E. Pisarski . PRESERVING THE AMERICAN DREAM Oct 2013. New approach for CIA based on ACS structure . Not just a book – a series of 16 briefs Briefs are backed by data sets All are downloadable and FREE Co-authored with Dr. Steven Polzin of USF

E N D
Commuting in America 2013Alan E. Pisarski PRESERVING THE AMERICAN DREAMOct 2013
New approach for CIA based on ACS structure • Not just a book – a series of 16 briefs • Briefs are backed by data sets • All are downloadable and FREE • Co-authored with Dr. Steven Polzin of USF • Housed at AASHTO; Supported by the CTPP • The intent is continuity for CIA into the future • Ability to do updates as data arrive • Reports now dated rather than numbered • Hello CIA 2013; Good-bye CIA IV
Women’s mode choice moves closer to mens 2011 ACS Re departure for work At 6:30 am men 2x women 6:30 – 7:30 it’s a guy thing At 7:30 they are = After 7:30 women predominate
Figure 7-11 Distribution of Workers by Household Vehicle Availability
About the same number of households without vehicles since 1980 – 10 million 9% of hh have no vehicles; but only 3% of hh with workers have none And in only 8% are there more workers than vehicles In the rest cars = or exceed workers 2011 9.3% 2012 9.2%
Figure 7-9 Long-Term Trend in Households with Zero Vehicles by Racial/Ethnic Group
SOME HELP ON VEHICLE SPENDING A guide to spending on vehicles 2011 CEX Lowest income $3,256 Average income $4,365
A QUICK VIEW OF SOME FINDINGS • Growing National Disparities • 1000 counties lost population ; 1000 gained 97% of population • More of >65 population is at work = circa 15% • 28% of households have no workers • 2/3rds of workers (93 million) live in households with other workers • Commuting remains extremely important but it's share of travel appears to have stabilized at levels meaningfully below those in prior decades. • Personal vehicle commuting retains a dominant share; however, change is limited in share • Carpool losing market share until a 2012 uptick • Women more oriented to SOV than men • Women’s overall mode distribution moving closer to Men’s • The transportation share of consumer spending declined w recession, now in rebound • 2011 travel time = 25.5 minutes; identical to 2000 • Walk to work (2.77%) share half of share in 1980 (5.6%) • Work at home increases from 2 million in 80 to 6 in 2010 • Workers working outside their county of residence quadrupled since 1960; now at 27%
Isn’t it suspicious that the problem is always individual behavior and the solution is always government action? Robert Bradley Jr. Thank you Alan E. Pisarski