Download
1 / 30
300 likes | 423 Views
Challenges for Broadband Access Infrastructure: Bridging Digital Divide. Abhay Karandikar Department of Electrical Engineering Indian Institute of Technology-Bombay Mumbai 400076- India Abhay Karandikar. Outline. Broadband deployment scenario in India Next Generation Access Technologies

E N D
Challenges for Broadband Access Infrastructure: Bridging Digital Divide Abhay Karandikar Department of Electrical Engineering Indian Institute of Technology-Bombay Mumbai 400076- India Abhay Karandikar
Outline • Broadband deployment scenario in India • Next Generation Access Technologies • Optimal Access Architecture • Technology Development at IIT Bombay
Challenges to bridge Digital (Information !) Divide • Affordability • Access devices. • Connectivity. • Human Capital (Digital skills and capacity) • General cognitive sense and skills necessary to make sense of online information. • Basic reading and writing skills required • Most web information available only in text form. • Need audio/video interface. • Access Interface • Needs to be more intuitive, simple. • Language Skills • Need for multi-lingual information access
Affordability • In US, service provider can earn revenues to the extent of US$ 360 per year per household for 90% household. • In India, 90% households may not afford more than US$ 100. • In India, minimum data rate of 256 Kbps is considered as broadband.
Broadband Scenario in India and other Asian countries • Number of Households • Korea- 14.3 M • China-333M • India-192 M • Broadband Connections (Year 2005 end) • Korea- 11M • China- 64.3 M • India- 0.9 M (current numbers about 2 M) • Indian Target • 9M (2006) • 30M (2007) • 50 M (2010) Source- • Telecom Regulatory Authority of India, “Broadband India: Recommendations on Accelerating Growth of Internet and Broadband Penetration”, April 2004. http://www.trai.gov.in/Recommendations_content.asp?id=21 • China Internet Network Information Center, “17th Statistical Survey Report on the Internet Development in China”, January 2006. http://www.cnnic.net.cn/download/2006/17threport-en.pdf • Ministry of Information and Communication, National Internet Development Agency of Korea, “Survey on the Computer and Internet Usage [2005.12]”, March 2006. http://isis.nida.or.kr/eng_report_down/upload/user_sum_eng_200512.pdf
Problems for Service Providers • Challenges • Poor Infrastructure • Diverse demographics • High Capital costs • Technologies in use • TDM Model • DSLAM Model • Cable TV and Local Service Provider Model
Issues • Advantages • Offers Guaranteed Quality of Service • Fast protection and restoration • Reliability • Bottlenecks • No flexibility to scale with the needs of the customer • High cost of installation and slow provisioning • Bandwidth does not grow linearly with customer demands • Low bandwidth
Bottlenecks • Of 40 Million copper lines owned by state-owned Telco in India, only about 7 millions are technically fit for carrying DSL signals. (Source-Telecom Regulatory Authority of India, “Broadband Policy 2004”. http://www.trai.gov.in/broadbandpolicy.asp ) • The Broadband policy required these incumbent telcos to provide 1.5 M by end 2005. • Only 0.35 M could be provided by November 2005. • Local loop unbundling has hardly happened. • High cost of network elements in SDH and ATM backhaul network.
Bottlenecks • Deployment and maintenance operationally challenging • Cable infrastructure in most cities does not have bi-directional support • In local service provider model, enterprise grade switch is used • No security or user isolation. • No proactive network management • No traffic policing or rate shaping • No Quality of Service Guarantees • No built-in-redundancy
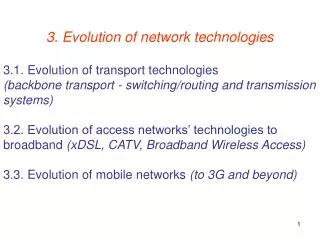
Next Generation Access Technologies • Next Generation SDH • Optical Ethernet or Ethernet over Fiber
Next Gen SDH • Very popular in those carriers who already have installed base of SDH rings. • Good choice of deployment when the predominant traffic is circuit switched. • May be inefficient if the predominant traffic is bursty packet switched data. • Ethernet over Fiber and Copper is the solution.
Ethernet in Access • Reduces the cost of per user provisioning • Relative technical simplicity • Due to large installed base • Efficient and Flexible transport • Can offer a wide range of speeds from 128 Kbps to 10 Gbps. • Ease of Interworking • Plug and play feature • Ubiquitous adoption • Ethernet is the dominant technology of choice in enterprise and campus LAN
Ethernet Deployment in Access • Hub and Spoke Configuration • Dedicated fiber/wavelength/copper is used for connectivity. • Gigabit Ethernet Ring • Fully meshed architecture
But what are the limitations with native mode Ethernet ? • How to identify different customers? • Notion of Ethernet virtual circuit like ATM VC that connects two or more UNI. • How to enforce QoS? • Guaranteed SLA and QoS Attributes • Committed Information Rate (CIR) • Committed Burst Size (CBS) • Peak Information Rate (PIR) • Maximum Burst Size (MBS) • Protection Mechanism • In-service performance monitoring • How to scale the number of customers?
Ethernet as Transport Mechanism in native mode • VLAN Tagging • Point to point VLAN can be used to establish virtual circuit • VLAN Stacking • An already tagged frame can be tagged again to create a hierarchy. • 802.1Q in 802.1Q (Q-in-Q) • Protection and Restoration • Spanning Tree and Rapid Spanning Tree protocol (IEEE 802.1s) • QoS • Using 802.1p priority mechanism • OAM • IEEE 802.1ag
Challenges with an All Ethernet Access • Scalability • Limited VLAN tag space allows only 4096 VC to be set up • Traffic Engineering bottlenecks • Spanning Tree allows only one loop free path which can result in uneven load distribution • Service Provisioning • VLAN assignment and provisioning • Limited protection and restoration available only through rapid spanning tree • 50 ms resiliency not possible. • TDM voice over Ethernet
MPLS bridges the gap • MPLS can address the limitations of VLAN space, scaling with spanning tree, carrying VLAN information within network. • Hybrid L2 Ethernet in access and IP/MPLS based core network is proposed for deploying Ethernet services.
MPLS as the transport mechanism in Core • Scalability in terms of aggregation • End to End QoS • Guaranteed Bandwidth LSP • Offers circuit setup and traffic engineering capabilities • Protection and Restoration • MPLS-TE (Backup LSP/LSP Preemption, Fast Reroute Option) • Support of TDM voice • Circuit emulation
Optimal Access architectures • MES architecture • MES with carrier class features and fiber uplink. • Suffers from low port-fill rate leading to higher cost per port. • While fiber to every building is ultimate goal, deployment scenarios in the field are very complex. • MTU architecture • Multi-tenant unit • First level of aggregation. • 4-8 port for optimal utilization. • Uplink- Fiber or VDSL • Access Multiplexer-Switch • Second level of aggregation. • Flexible Physical interfaces (VDSL, Ethernet over CAT5, Ethernet over Fiber)
Comparisons • LSP Model • Least expensive • Residential subscribers tend to overlook problems in favor of cost factor. • MES Model • Low-port fill rate leading to higher cost per port. • Low device port density results in higher cost for upstream devices. • MES/MTU Model • Suits best for providing affordable access in countries like India.
Technology Development • Eisodus Networks company incubated at IIT Bombay has developed solution based on MES-MTU architecture. • www.eisodus.com
EisoAccess Architecture • The architecture has two kind of nodes • ENode (access node) • Typically a MDU or MTU • ESLAM (Aggregator or concentrator) • Element Management System with NBI • Ethernet Circuit • Statically provisioned through NMS • Dynamic provisioning through proprietary protocol • QoS architecture with TM features conforming to MEF standards. • TDM voice over Ethernet
Conclusions • Cost competitive access infrastructure key to bridge information divide. • Discussed various technology options. • Ethernet over Fiber with VDSL in last few hundred meters based MES-MTU architecture seems promising. • We also need • Affordable computing platforms • Rich information environment • Content, language, interface, information retrieval
References • Telecom Regulatory Authority of India, “Broadband Policy 2004”, 2004. (http://www.trai.gov.in/broadbandpolicy.asp) • A. Jhunjhunwala, “Drivers of Telecom in India”, IETE Technical Review, Vol 20, No 4, July-August 2003. • http://www.broadband.gc.ca/pub/program/NBTF/recommendations.html#definitions • Telecom Regulatory Authority of India, “The Indian Telecom Services Performance Indicators October - December 2005”, April 2006. http://www.trai.gov.in/Reports_content.asp?id=24 • Telecom Regulatory Authority of India, “Broadband India: Recommendations on Accelerating Growth of Internet and Broadband Penetration”, April 2004. http://www.trai.gov.in/Recommendations_content.asp?id=21 • China Internet Network Information Center, “17th Statistical Survey Report on the Internet Development in China”, January 2006. http://www.cnnic.net.cn/download/2006/17threport-en.pdf • Ministry of Information and Communication, National Internet Development Agency of Korea, “Survey on the Computer and Internet Usage [2005.12]”, March 2006. http://isis.nida.or.kr/eng_report_down/upload/user_sum_eng_200512.pdf • Rajendra Singh, “Letter F.No.2-2/2004-CN: Broadband 2004 - targets and achievement”, November 2005. http://www.trai.gov.in/Recommendations_content.asp?id=5