Download
1 / 76
760 likes | 881 Views
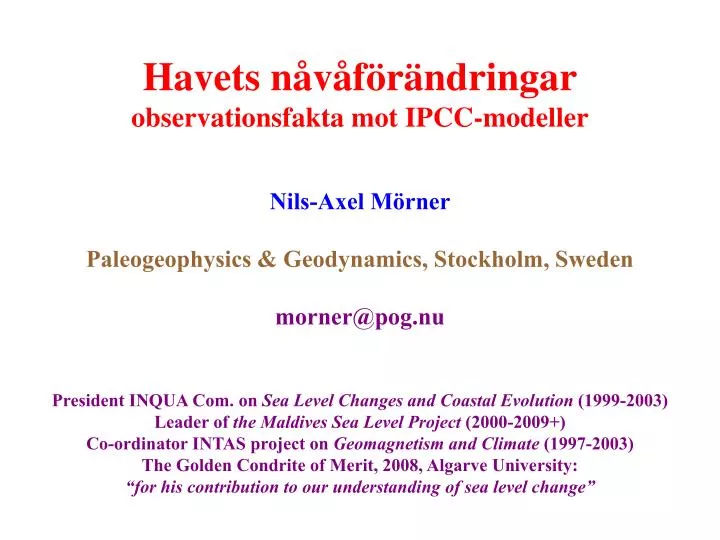
Havets nåvåförändringar observationsfakta mot IPCC-modeller Nils-Axel Mörner Paleogeophysics & Geodynamics, Stockholm, Sweden morner@pog.nu

E N D
Havets nåvåförändringarobservationsfakta mot IPCC-modeller Nils-Axel Mörner Paleogeophysics & Geodynamics, Stockholm, Sweden morner@pog.nu President INQUA Com.on Sea Level Changes and Coastal Evolution (1999-2003) Leader of the Maldives Sea Level Project (2000-2009+) Co-ordinator INTAS project on Geomagnetism and Climate (1997-2003) The Golden Condrite of Merit, 2008, Algarve University: “for his contribution to our understanding of sea level change”
Förändringar har Fördelar och Nackdelar • det gäller i högsta grad för Global Warming • Men inget gott kan komma från en snabb stigning av havsytan • Därför ar detta • Det enda Verkliga Hotet • Fast i sanning, Så Helt Fel ! • quod erat demonstrandum
Det är det här det handlar om Observationsfakta eller Modeldata
1. maximal isavsmältning och global sea level
De glaciärer som finns idag kan aldrig smälta fortare än istidens enorma ismassor Smältningen av istidens glaciärer tog 10,000 år Och havsytan steg då med 10 mm/år (1 m/100 år) Vilket sätter en yttersta gräns för en möjlig havsytestigning idag
The rate of glacial eustatic rise after LGM was ~10 mm/yr and sets the ultimate limit of possible sea level changes in the present century (yellow).
IPCC is coming down with time ! COMPARE: Mörner, 1991 ~0.0 Mörner, 1996 <+10 cm INQUA, 2000 +10 ±10 cm Mörner, 2004 +5 ±15 cm Mörner, 2010 +5–7 ±10 cm
2. Thermal Expansion
3. Sea Level Changes
OBSERVATIONAL FACTS Numerous interacting factors control the stability of the shoreline
The combined observational records (in mm/year) for the last 300 years. It shows variations – ups and downs – but no trend. For year 2100, INQUA gives predictions in line with this record, whilst the IPCC scenarios lie far above – way off – observational data
4. Nature’s own observational records
5. The Maldives Dömd att översvämmas om 50-100 år
The new sea level curve of the Maldivesrecording a seven oscillations driven by the redistribution of ocean water masses (from Mörner, 2007)
Fen-to-lake records on the island of Goidhoo ~1970 1790 ~1700
Queen’s Bath (4) +0.6 m ~400 BP (3) +20-30 cm >1970 (2) Present HTL (1) Present MTL
At ~1970 Sea Level fell some 20 cm Causing erosion with sand deposition outward, downward Leaving an old fossil shore and an old overgrewing surface of grey weathered corals. The present shore has remained stable for ~30 years The two laked on Goudhoo dried up
Shore on map from 1922 Platform >1970 Platform >1970 Fall ~1970 Platform <1970
Sea level changes in the Maldives from 1500 to 2009 and 2100 No reasons for any alarm. Sea level has been stable for the last 30 years. Maximum future change may be a return to a pre-1970 level
Cabinet under water President in water Past-Present-Future sea level changes no threat at all !
6. Bangladesh an area cursed by repeated flooding and doomed to experience terrible flooding disasters in the near future
Coastal Erosion ! Sea is Rising ! The IPCCers say
kusterosion – ja men – ingen havsytestigning vilket klart framgår av trädens rötter som sprider sig horisontellt på precis samma nivå som i skogen bakom
The original clay surface was just above the horizontal roots
The wreck is stranded at HTL with a storm beach behind. This suggests a slight lowering with respect to the delta surface
Sea Level Changes in Bangladesh There is no global sea level rise in Bangladesh
INDIA BANGLADESH MALDIVES
7. Tuvalu and Vanuatu Both island-groups claimed already to be in the process of becoming flooded
Tuvalu – tide gauge record 8 years of slow rise (installation subsidence?) is followed by 22 years of stability – i.e. no sea level rise the 3 low levels represent ENSO-events
The Vanuatu News Port Vila Press Online, December 2005 declaired that ”a small community living on Vanuatu has had to be formally moved out of harms” as an effect of the proposed sea level rise and flooding concept. Vanuatu, another notorious site of ”flooding”, shows, in fact, no sign of any ongoing sea level rise
8 Venice - a good test site Located in the slowly subsiding Po delta any sea level rise or acceleration would be easily detected
Venice, built on delta deposits, experiences a long-term subsidence (blue line). Sea level (pink) fluctuated around this line from 1870 to 1970. No eustatic sea level rise is seen, and from 1970 there even is a sea level lowering recorded
9. North-west Europe land subsidence long the North Sea coasts and the periphery of uplift in the Kategatt Sea
From 1840 t0 1940 sea level rose by 11 cm – blue line the Earth’s rate of rotation (LOD) ≈ 10 cm– green line
COXAHVEN 160 YEARS TIDE-GAUGE RECORD A mean-sinosidal relative sea level rise is composed of a long-term subsidence (red) of ~1.4 mm/year and a sinosoidal eustatic rise up to 1960 followed by a slight lowering
Korsör ligger på nollpunkten för landhöjningen undersenaste 8000 åren. Här skulle sann eustasy råda(that is, if the instrument is stably located, which is not at all certain) Vad ser vi? antingen 7,5 cm stigning 1895-2005 (svart linje) eller en segmenterad utan trend (red) ingem acceleration I sent tid (snarare motsatsen)
10. Satellite Altimetry A wonderful new tool to measure the ocean level but from where does the tilt come?
In 2000 Satellite altimetry – after all physical corrections – showed NO rising trend Just a variability around a zero level (blue) + a major ENSO event (yellow). This data set was presented on the TOPEX/POSEIDON web-page, in their publications, and used by me in my paper in Global and Planetary Changes, vol. 40, 2004, p. 49-54
In 2003 a totally new record appeared Now there was a trend of 2.3 mm/year. This trend is inferrend – not measured