Download
1 / 41
1.9k likes | 4.85k Views
Electron microscopy- SEM, ESEM, TEM and EDS. Dr. Karin Habermehl-Cwirzen. Lecture content: 1.Scanning Electron Microscope SEM 2.Energy Dispersive Spectrometer EDS 3. Environmental Scanning Electron M. ESEM 4. Transmission Electron Microscope TEM.

E N D
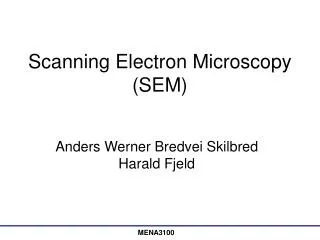
Electron microscopy- SEM, ESEM, TEM and EDS Dr. Karin Habermehl-Cwirzen
Lecture content: 1.Scanning Electron Microscope SEM 2.Energy Dispersive Spectrometer EDS 3. Environmental Scanning Electron M. ESEM 4. Transmission Electron Microscope TEM
http://www.youtube.com/watch?v=UUcQSw7oO0k Zoom into concrete
Resolution resolution the ability to see two objects as separate human eye 0.2 mm light microscope 0.25 µm SEM 5-10 nm TEM 0.5 nm There are 100 cm in one meter. There are 1,000 mm in one meter. There are 1,000,000 micrometers in one meter. There are 1,000,000,000 nm in one meter. There are 1,000,000,000,000 pm in one meter. The light microscope – easy, fast and shows the real colouring – is not good enough to make very small items visible.
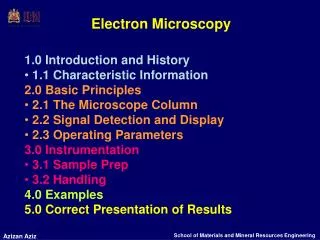
Electron microscopy Prototype: 1931 by Ernst Ruska and Max Knoll (Nobel Price 1986!) Uses a beam of electrons to obtain a magnified image The beam is focused and rastered across the surface of the specimen.Several interactions with the specimen occur, leading to electrons and photons. These emitted particles can be used to obtain information about the specimen.
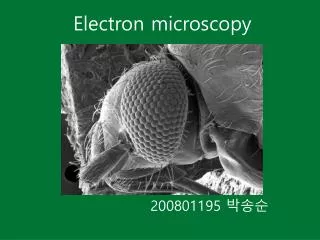
Electron microscopy • Where is Electron Microscopy used? • Biological specimens: Microorganism, Cells, Flies, Ticks • Forensics (CSI…) • Metals • Semiconductos industry (e.g. quality control) • But also in building materials like concrete, wood etc. (development of new building materials, ancient building materials, material failure like fracture…)
Sample preparation for SEM • Sample has to have the right size for the chamber/sample holder • Cannot be destructive to the UHV (water removed etc) FINGERPRINT free • Sticked on a conductive tape for electcrically grounding • Conductive sample or conductive coating (Metals are easier than non-conductive specimens)
Electron gun • Is used to generate beam of electrons to 'bombard' the sample • The electrons leave the filament and are attracted to the anode. • The anode is maintained at a positive voltage relative to the filament, ranging from 5 to 30 kV in scanning electron microscopes
Electron beam – material interaction leads to • Elastic events - affects the beam electrons trajectories without significantly changing their energy (BSE) • Inelastic events – result in transfer of energy to the solid (producing SE; X-ray, Auger electrons etc)
Interaction Volume: depends on beam energy, material • The size of the interaction volume depends on: • Electron energy • Atomic number of sample • Density
What kind of signals are obtained with SEM? These signals contain information about the surface topography, the composition etc
SEM-BSE image Backscattered electrons 50eV up to the initial beam energy Consist of high energy electrons originating from the electron beam, which were elastically scattered. Since heavy atoms backscatter electrons more strongly than light elements, BSE images can be used to detect contrasts between areas with different chemical composition: Lighter elements appear darker, heavier elements appear lighter The detector is usually placed above the sample in a kind of doughnut type arragement, concentric with the electron beam
SEM- SE image Most common imaging mode They are called secondary electrons as they were generated by the primary electrons (of the electron beam). Are low-energy electrons (<50eV). These were ejected from the K-orbitals of the sample atoms, by inelastic scattering with the electron beam. Due to the low energy they have to come from the very surface of the sample (few nm), the other ones from below are stopped inside the sample.
These electrons are detected, e.g. by a Everhart-Thornley detector (combination of scintillator and photo-multiplier) The brightness of the spot depends on the number of secondary electrons reaching the detector. At steep surfaces or edges more secondary electron can reach the surface, therefore these areas look brighter. The secondary electron images gives therefore an image of the surface.
Provides information about topography • Detector located on one side (topographic effect pronounced) Faces oriented towards the detector will be brighter, whereas those in the opposite direction will be dark • Average number of SE produced per primary electron depends on angle of tilt of the specimen relative to the primary-electron beam. The value is lowest for perpendicular incidence (φ = 0) • More SE are caused by BSE then primary beam electrons
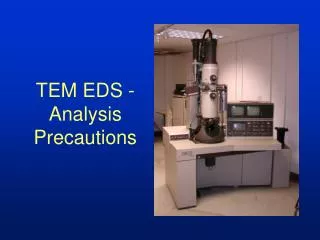
EDS Energy-Dispersive X-ray Specroscopy In principle the X-rays emission can be stimulated by any high-energy beam of charged particles, like electrons, protons, or other beam of electrons. In SEM and ESEM the particle source is the electron beam. The incident electron beam may excite an electron in an inner shell, ejecting it from the shell while creating an electron hole where the electron was. An electron from an outer, higher-energy shell then fills the hole, and the difference in energy between the higher-energy shell and the lower energy shell may be released in the form of an X-ray (or Auger Electron). The number and energy of the X-rays emitted from a specimen can be measured by an energy-dispersive spectrometer. As the energy of the X-rays are characteristic of the difference in energy between the two shells, and of the atomic structure of the element from which they were emitted, this allows the elemental composition of the specimen to be measured.
So the signal gives you the information of the elemental composition, as each element has a unique atomic structure and therefore a unique set of characteristic X-rays. • Produced during de-excitation of an atom following the ejection of an inner-shell electron • Sufficiently energetic beam electron can eject an inner shell electron, K, L, or M • In the process of relaxation transition of electrons occur from one shell to another and possible result is emission of excess energy in the form of photon • Energy of photon equals the energy release for the shells taking part in the transition
EDS remarks: Problems: • detector window: elements with atomic number less than 4, (Hydrogen, Helium and Lithium) cannot be detected. • Overlapping peaks • X-rays are emitted in all directions, The likelihood of an X-ray escaping/being detected are depending on the X-ray energy and the amount and density of the material it has to pass though. Inhomgenous or rough samples can give inaccurate results.
Electron microscopy Electron microscopes are expensive to build and maintain. (High voltage supplies, cooling water, high/UHV systems) Sensitive to vibrations (sometimes special buildings needed and working times can be odd-like at night)
SEM (+EDS) Advantages/Disadvantages Disadvantages: • Vacuum • Dehydration or cryofreezing • Conductive coating prevents the accumulation of negativ charge on the sample surface, which would influence the electron beam, coating can be gold, gold/platinum, platinum, graphite • Spot-size and interaction volume is to big to achieve atomic resolution. • Resolution about 1 magnitude smaller than TEM Advantages: • Bigger samples (as these are surface processes (several cm size) better representation of complete samplecompared to TEM • Bulk materials • Variety of analytical modes • !Relatively new are SEM capsules also extra samples for cement-based materials
SEM http://www.youtube.com/user/acmeschool#p/search/0/lrXMIghANbg
Why Vacuum? Air consists of molecules Electrons scatter on the molecules Exception: The ESEM! Environmental SEM, pressure up to 20Torr, can be wet environment.
ESEM Environmental Scanning Electron Microscope Developed by Australian Gerasimos “Gerry” Danilatos, University of New South Wales First commercial ESEMs in the late 80s by ElectroScan ESEM: non-conductive samples and (no) vacuum Basic princple is the same as SEM, but…
p0>>p1>>p2 The specimen chamber sustaining high-pressure gaseous environment is separated by the electron gun, by two gas pressure stages Leaking gas is pumped away After passing PLA2 (pressure limiting aperture) the electron beam looses electrons due to electron scattering by gas molecules. The scattered electrons are contributing to the background noise signal.
As it is the same interaction principle as in SEM, the signals are the same: BSE SE X-ray A normal SE detector cannot be used in the gas atmosphere because of the bias
GDD Gaseous detection device The environmental gas is used as a detector SE/BSE are accelerated towards an anode and on their way they generaste a electron cascade due to collision with the gas molecules. BSE travel longer ways therefore their signals picked up at other electrodes.
ESEM Advantages/Disadvantages Advantages: Coating is unnecessary! (Coatings are difficult or impossible to remove), can conceal small features Samples might be needed from several persons (e.g. in criminal cases) then cover might be unwanted. Disadvantages: Limitation in distance 1cm to smaller than mm X-rays can be additional generated by the surrounding gas.
ESEM Paul Reavis next to his barn in Wisconsin Eric Patterson beside his papercrete living room
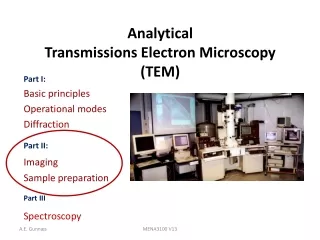
TEM Unlike the SEM, TEM collects the electrons that are transmitted through the specimen. Like the SEM, a TEM uses an electron gun to produce the primary beam of electrons that will be focused by lenses and apertures into a very thin, coherent beam. Electron beam energy 50-350eV IN TEM a beam of electrons TRANSMITS through a ultra thin specimen. The electrons interact with the specimen as they pass through. An image is formed from the transmitted electrons on a screen or CCD camera etc. The TEM sample is very small as the grid is very small (3mm diameter)
TEM sample preparation • Mechanical milling with diamond paste + additional thinning Followed by: • Chemical etching: Metallic specimens, which can be chemical eched, e.g. with an acid • Ion etching: Plasma stream is impidging on the surface (e.g. Argon). Very slow. The sample has to be thinner than 200nm.
TEM- bright/dark field images Two basic techniques Bright field imaging: detecting the transmitted electrons Dark field imaging: detecting the diffracted or scattered electrons. The beam is first focused by a condenser. It then passes through the object, where it is partially deflected. The degree of deflection depends on the electron density of the object. The greater the mass of the atoms, the greater is the degree of deflection. Biological objects have only weak contrasts since they consist mainly of atoms with low atomic numbers (C, H, N, O). Consequently it is necessary to treat the preparations with special contrast enhancing chemicals (heavy metals) to get at least some contrast.
TEM advantages/disadvantages Advantages: Resolution 0.5Å (50pm) Magnification 50.000.000x You can determine position of atoms Disadvantes: time consuming Dehydration needed Expensive Extremly thin sections (less than 100nm) Small sample sizes (does this represent the whole sample?) UHV
TEM http://www.youtube.com/watch?v=fToTFjwUc5M
Final remarks: All these techniques are ”standard” in building materials development or building materials characterization http://www.youtube.com/watch?v=tCWF7_-FOrw (100 year old concrete) THANK YOU!