Download
1 / 22
220 likes | 341 Views
A Comparison of Activity-Specific Importance and Management Preferences Among Three Specialization Groups of Trout and Bass Anglers. Laura E. Anderson David K. Loomis Human Dimensions Research Unit Department of Natural Resources Conservation University of Massachusetts

E N D
A Comparison of Activity-Specific Importance and Management Preferences Among Three Specialization Groups of Trout and Bass Anglers Laura E. Anderson David K. Loomis Human Dimensions Research Unit Department of Natural Resources Conservation University of Massachusetts Amherst, Massachusetts 01003 15th Northeastern Recreation Research Symposium April 8, 2003
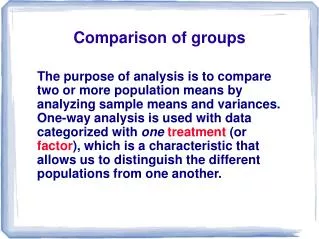
Fisheries Management • Traditionally resource-oriented • focused on biological and economic goals • Recent emphasis on using Human Dimensions research to segment into meaningful user groups • Thus, two approaches • segmentation by species targeted • recreation specialization
Recreation Specialization • First defined by Bryan (1977) as: • “a continuum of behavior from the general to the particular, reflected by equipment and skills used in the sport and activity setting preferences” • Re-defined by Ditton et al. (1992) using social worlds literature: • “a process by which recreation social worlds and subworlds segment and intersect into new recreation subworlds, and the subsequent ordered arrangement of these subworlds and their members along a continuum”
Recreation Specialization • Eight propositions (Ditton et al. 1992) • Two propositions considered here: • As specialization increases, • importance of activity-specific elements will decrease relative to non activity-specific elements • acceptance and support for rules, norms and procedures will likely increase • Specialization Index (Salz et al. 2001) • Social Subworlds (Unruh, 1979) • orientation, experiences, relationships, and commitment
Species Targeted • Trout anglers vs. bass anglers • the two most sought species in Massachusetts • trout stocked in put-and-take fisheries, bass reproduce naturally • recent emphasis in both groups is on “catch and release” • trout anglers perhaps seen as the more “sophisticated fly fisherman” in popular myth • Species targeted may relate to angler specialization • flathead and blue catfish anglers more specialized than channelcatfish anglers (Wilde and Reichers, 1994)
Hypotheses • Specialization distribution: • Ha1: Trout and bass anglers differ in overall specialization level • Activity-specific elements: • Ha2: High-specialization anglers will attach less importance to activity-specific elements of the fishing experience than will low-specialization anglers • Ha3: Trout and bass anglers will differ in perceived importance of activity-specific elements
Hypotheses • Non activity-specific elements: • Ha4: High-specialization anglers will attach more importance to non activity-specific elements of the fishing experience than will low-specialization anglers • Ha5:Trout and bass anglers will differ in perceived importance of non activity-specific elements of the fishing experience
Hypotheses • Management items: • Ha6: High-specialization anglers will have greater support for various management tools and regulations than will low-specialization anglers • Ha7: Trout and bass anglers will differ in support for management tools and regulations
Methods • Data Collection • 1998 survey of 2,930 Massachusetts freshwater anglers • mail questionnaire using Salant and Dillman Total Design Method • Specialization Index (Salz et al., 2001) • four specialization levels
Methods • Species Targeted • questionnaire item: “Please name the freshwater fish that you actually fish for most often in Massachusetts.” • species listed most often coded into general fish type (e.g. rainbow trout = trout) • Data Analysis • chi square test for differences in specialization level distribution between bass and trout anglers • two way ANOVA using “species targeted” and “specialization level” as factors • 0.10 level of significance
Results Response Rate Initial sample………………………… 2,930 -- Mortality……………………………….. 344 -- Effective sample……………………... 2,586 100.0 Nonresponse…………………………. 1,175 45.4 Useable returned surveys……………. 1,41154.6 Trout or bass preference and specialization level indicated (level 2, 3, or 4)……………………... 1,076 76.3 Trout ………………………………… 440 40.9 Bass …………………………………. 636 59.1 Type of response N %
Hypotheses Testing: Ha1 X2 = 0.883 p = 0.643
Hypotheses Testing: Ha2Activity-specific Items Level of specialization For the sport of fishing, not to obtain food to eat …………….. 3.6553.9244.203 13.840 0.000 For the experience of the catch……. 3.6053.8194.090 13.575 0.000 I’m just as happy if I release the fish I catch…………………… 4.176 4.1884.399 6.500 0.002 A fishing trip can be successful even if no fish are caught………... 3.799 3.8094.031 5.457 0.004 I’m just as happy if I don’t keep the fish I catch…………………… 4.127 4.1784.325 3.047 0.048 _______________________________________________________________ To obtain fish for eating, and not for sport…………………. 1.413 1.460 1.526 1.732 0.178 When I go fishing, I’m just as happy if I don’t catch a fish …….. 3.018 3.026 3.103 0.357 0.700 ItemsM V H F p
Hypotheses Testing: Ha3 Activity-specific Items Fish targeted I’m just as happy if I don’t keep the fish I catch ………………… 3.897 4.417 70.654 0.000 I’m just as happy if I release the fish I catch ………………………. 3.943 4.450 68.924 0.000 To obtain fish for eating, and not for sport ……………………...1.697 1.306 44.650 0.000 For the sport of fishing, not to obtain food to eat …………………. 3.632 4.137 38.307 0.000 For the experience of the catch…………. 3.617 3.989 27.854 0.000 _____________________________________________________________________________________ When I go fishing, I’m just as happy if I don’t catch a fish …………. 3.097 3.010 1.352 0.245 A fishing trip can be successful even if no fish are caught ……………. 3.854 3.875 0.102 0.749 ItemsTrout Bass F p
Hypotheses Testing: Ha4Non Activity-specific Items Level of specialization To experience adventure and excitement …………………. 3.3873.7544.017 22.556 0.000 To be close to the water …………... 3.2543.5643.887 18.293 0.000 To be with friends…………………. 3.080 3.1733.561 13.644 0.000 To experience new and different things …………………. 2.778 2.9393.273 11.879 0.000 For relaxation……………………… 4.226 4.3654.550 11.280 0.000 To experience natural surroundings ……………………. 4.0844.2624.419 10.023 0.000 To be outdoors…………………….. 4.144 4.2654.426 7.419 0.001 To get away from the demands of other people ………... 3.404 3.4633.834 7.266 0.001 To get away from the regular routine ………………….. 3.812 3.8764.153 7.124 0.001 _____________________________________________________________________________________________________________________________ For family recreation………………. 3.155 3.087 3.226 1.092 0.336 ItemsM V H F p
Hypotheses Testing: Ha5 Non Activity-specific Items Fish targeted To be with friends………………………. 3.064 3.387 15.901 0.000 To experience adventure and excitement ………………………. 3.575 3.838 12.969 0.000 For family recreation…………………… 3.019 3.228 6.673 0.010 To get away from the regular routine ….. 3.856 3.989 3.737 0.053 ____________________________________________________________ To be close to the water ………………... 3.501 3.621 1.286 0.257 To get away from the demands of other people …………….. 3.516 3.571 0.461 0.497 For relaxation…………………………... 4.380 4.379 0.379 0.538 To experience natural surroundings …… 4.259 4.258 0.351 0.554 To be outdoors…………………………..4.279 4.276 0.233 0.630 To experience new and different things ………………………. 2.974 3.000 0.053 0.819 ItemsTrout Bass F p
Hypotheses Testing: Ha6 Management Items Level of specialization Maximum size……………………... 3.2853.5743.745 10.736 0.000 No stocking allowed……………….. 3.599 3.6813.924 9.601 0.000 Creel limit………………………….. 4.171 4.2704.476 8.821 0.000 Minimum size limit………………... 4.134 4.2264.454 7.870 0.000 Mandatory catch and release……… 3.117 3.2003.474 6.612 0.001 Slot limit…………………………… 3.078 3.1733.399 6.211 0.002 Stock non-native fish……………… 3.0733.274 3.360 5.208 0.006 Stock native fish…………………… 4.260 4.3204.406 3.095 0.046 Restricted fishing area…………….. 3.360 3.2333.055 2.463 0.086 _______________________________________________________________ Prohibit use of certain gear ……….. 3.657 3.522 3.603 2.182 0.113 Voluntary catch and release ………. 3.942 3.998 4.007 0.325 0.723 ItemsM V H F p
Hypotheses Testing: Ha7 Management Items Fish targeted Minimum size limit…………………….. 4.043 4.417 20.779 0.000 Voluntary catch and release …………… 3.844 4.084 12.854 0.000 Restricted fishing area………………….. 3.371 3.111 11.770 0.001 Prohibit use of certain gear…………….. 3.683 3.506 10.197 0.001 No stocking allowed……………………. 3.806 3.670 6.085 0.014 Mandatory catch and release …………... 3.147 3.326 3.584 0.059 ___________________________________________________________ Maximum size………………………….. 3.459 3.607 2.497 0.114 Stock native fish………………………... 4.329 4.326 0.502 0.479 Slot limit………………………………... 3.231 3.197 0.477 0.490 Creel limit………………………………. 4.307 4.296 0.456 0.500 Stock non-native fish…………………… 3.230 3.256 0.134 0.715 ItemsTrout Bass F p
Discussion • No difference in specialization distribution between trout and bass anglers • Recreation specialization theory strongly supported for the two propositions tested: • Activity-specific items • five out of seven items supported proposition • Non activity-specific items • nine out of ten items supported proposition • Management items • nine out of 11 items supported proposition
Discussion • Some differences found between trout and bass anglers: • Activity-specific items • bass anglers gave a slightly lower response in all 5 out of 7 items where a difference occurred • Non activity-specific items • bass anglers gave a slightly higher response in all 4 out of 10 items where a difference occurred • Management items • No clear pattern found for either bass or trout anglers on five out of 11 items where a difference was found
Discussion Keeping fish and catching fish for food • not especially important to either group of anglers, but • slightly less important to bass anglers • Relaxation, experiencing nature and the outdoors • very important to all anglers • Being with friends and family, and excitement • slightly more important to bass anglers • Mandatory and voluntary catch-and-release programs • supported more strongly by bass anglers
Conclusions • Overall, greater differences found according to specialization level than by species targeted • Some evidence that highly specialized trout anglers differ from highly specialized bass anglers