Download
1 / 1
10 likes | 135 Views
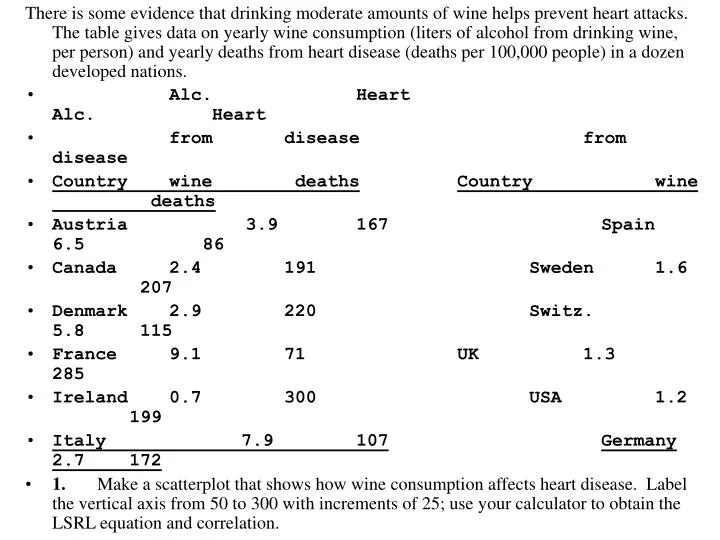
There is some evidence that drinking moderate amounts of wine helps prevent heart attacks. The table gives data on yearly wine consumption (liters of alcohol from drinking wine, per person) and yearly deaths from heart disease (deaths per 100,000 people) in a dozen developed nations.

E N D
There is some evidence that drinking moderate amounts of wine helps prevent heart attacks. The table gives data on yearly wine consumption (liters of alcohol from drinking wine, per person) and yearly deaths from heart disease (deaths per 100,000 people) in a dozen developed nations. • Alc. Heart Alc. Heart • from disease from disease • Country wine deathsCountry wine deaths • Austria 3.9 167 Spain 6.5 86 • Canada 2.4 191 Sweden 1.6 207 • Denmark 2.9 220 Switz. 5.8 115 • France 9.1 71 UK 1.3 285 • Ireland 0.7 300 USA 1.2 199 • Italy 7.9 107Germany 2.7 172 • 1. Make a scatterplot that shows how wine consumption affects heart disease. Label the vertical axis from 50 to 300 with increments of 25; use your calculator to obtain the LSRL equation and correlation. 2. Formulate null and alternative hypotheses about the slope of the true regression line. Report the sum of the 12 residuals and the sum of the squares of the residuals. What is the value of s (the standard error about the line)? 3. The model for regression inference has 3 parameters: a, b, and s. Estimate these parameters from the data. 4. Computer output reports that the standard error of the slope is SEb = 3.511. Use this to construct a 95% confidence interval for the slope b of the true regression line.