Download
1 / 28
280 likes | 385 Views
FHWA Major Projects Estimate Training Florida TEA Conference and Workshop 2005. FHWA Major Projects Team:. Rodney Barry, Team Leader, (202)366-1561 Jim Sinnette, Engineering, (202)366-0479 Daniel C. Wood, Engineering, (202)366-4661 John Broadhurst, Finance, (202)366-5604

E N D
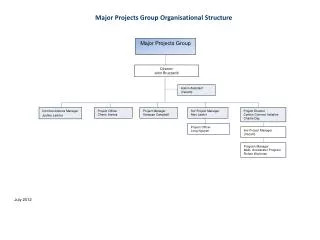
FHWA Major Projects Estimate TrainingFlorida TEA Conference and Workshop 2005
FHWA Major Projects Team: Rodney Barry, Team Leader, (202)366-1561 Jim Sinnette, Engineering, (202)366-0479 Daniel C. Wood, Engineering, (202)366-4661 John Broadhurst, Finance, (202)366-5604 Chris Allen, Risk Management, (202)366-4104 Phil Barnes, Stewardship/Oversight,(202)366-0733
SAFETEA-LU Title I – Federal-Aid Highways Subtitle I (Miscellaneous) Section1904. Stewardship and Oversight • Major Projects now $500 million • Value Engineering – More than 1 analysis for major projects. • Finance Plans still required • $100 million projects • Project Management Plans now required
SAFETEA-LU Title I – Federal-Aid Highways Subtitle I (Miscellaneous) Section1904. Stewardship and Oversight • Project costs.--The Secretary shall develop minimum standards for estimating project costs and shall periodically evaluate the practices of States for estimating project costs, awarding contracts, and reducing project costs.
14 States with $1 billion projects (TEA-21) DC 14 Active States
20 States with $500 million projects (SAFETEA-LU) DC 20 Active States
33 States with active and future $500 million projects DC 20 Active States 13 Future States
Cost Estimate Training for Major Projects • 2 Pilots in DC in FY 2005 • 1 Course in Atlanta – September 2005 • 1 Course in Austin – October 2005 • 2 Courses in St. Louis and Denver – December 2005 • Dwight Sangrey of Golder Associates will be delivering a course to the Minnesota DOT and to Eastern Federal Lands Highway Division
Why? • History of Cost Estimating issues with Major Projects • Government Auditing Agencies (GAO, DOT IG) • NCHRP 20-7 (152), Flyvbjerg, LA County Metro Transportation Planning Authority, etc. Another Resource: July/August 2004 issue of Public Roads
Why? • On a recent survey, FHWA Division Offices were asked what was needed to improve cost estimating: • Responses: • Nothing (32%) • Guidance (25%) • Best Practices (23%) • Other (11%) • Training (9%)
Why? • SAFTEA-LU • A financial plan shall– • ``(A) be based on detailed estimates of the cost to complete the project; and • ``(B) provide for the annual submission of updates to the Secretary that are based on reasonable assumptions, as determined by the Secretary, of future increases in the cost to complete the project.
LESSON 1: Recent example Evolution of Cost for Boston Central Artery & Tunnel 85 87 89 91 92 94 00 01 02
LESSON 2: Past ExampleInterstate Highway System Case Study 1954 to 2000 • Authorization in 1956 for 41,000 miles of high quality highway for estimated $27 B... ($1955) • Scope later increased to 42,500 miles • Revised estimate of cost in 1958 was $41B ($1957) • Original planned build-out schedule was 1975 • By 1980 … 40,000 miles completed—up to 42,793 today
LESSON 2: Past Example Evolution of Cost for US Interstate Highway System 1955 60 65 70 80 90 Again…scope & inflation are the changes
LESSON 3: Current Example • East Span of the San Francisco – Oakland Bay Bridge • Earthquake Retrofitting (just under $1 billion) • Things happened … • Now over $6 billion … • July 2005 Newspaper Reports • And scheduled for completion in 2012
As a result FHWA has begun implementing the following: “Major Project Program Cost Estimating Guidance” http://www.fhwa.dot.gov/programadmin/mega/cefinal.htm And Cost Estimate Training for Major Projects
Cost Estimating Guidance and Training • Guidance and Training are based on the concept of including estimates of all costs at all stages of a project. • Deterministic with contingencies = VDOT • Risk-based probabilistic = WS DOT • For Major Projects, there appears to be initial successes with risk-based probabilistic estimates, like WS DOT’s CEVP • Utah and Pennsylvania Turnpike have already used CEVP. • EFLHD is planning to use a risk-based assessment on one of their $10 million projects • Nevada, Minnesota, Texas have all expressed interest
Where Uncertainties (Risks) Need to be Resolved Preliminary Design Planning Programming Final Design A/B/A Construct Environment Right of Way Governance/Stakeholders Financing Civil & Environmental Justice Multi-modal Systems Teaming Options/Alternatives Geotechnical Structures Pavements Hydraulics Stormwater Tunnels Intelligent Transportation Permitting Contracts Insurance/Bonds Construction Methods MOT Market Conditions Disputes Weather Security SCOPE
Base Cost 0.2 Base Schedule 0.12 0.1 0.15 0.08 Probability 0.1 Probability 0.06 0.04 0.05 0.02 0 0 2160 1200 1320 1440 1560 1680 1800 1920 2040 78 87 96 105 114 123 132 141 Total Project Cost (Current $M) Total Project Duration (months after Jul/02) CEVP Results & Deliverables RICH SOURCE OF INFORMATION Current $ or YOE $ Quantified risk registry can feed & focus VE & Risk Management Cost Risk Contribution By Item also: • • uncertainty in escalated cost • • prioritized list of delay risks • • prioritized list of activities (for VE) • • effectiveness of risk management • • chance of meeting milestones • • cash flow
Using Results of a Risk-Based Analysis • Project Assessment & Validation • Risk Management • Communication • Financial Management
1 14% Future Leadership & Management 2 11% Contracting Process 3 11% Guideway Design Cost Risk 4 10% ROW Acquisition Uncertainty 5 8% Additional Parking Required 6 8% Urban Design Risk 7 6% other risk items 8 6% Utility Relocation Issues 9 5% Other Scope Risk 10 5% W. Seattle Bridge Design Risk all others 17% Cost Risk Contribution By Item – March 2003 Relative Contribution to Risk Cost Rank Rank
Uncertainty Decreases with Design Development Range of Initial Estimate
2002 -- Developed CEVP for proposed “mega-projects” in Seattle area (assessment & communication) Success led to broad application within WSDOT: More than 150 projects $10M up to $4B CREM staff function In use by 150+ staff CommunicationsCEVP – Washington State DOT
Communications • Value of audience understanding • More realistic expectations • Framework for time delay & low probability risk • WSDOT experience in 2002 is good example • The public is very savvy when it comes to transportation projects. • WS DOT CEVP • VDOT’s Dashboard
Financial Management (Programming) 0.12 0.1 0.14 0.1 0.12 0.08 0.08 0.1 0.06 0.06 Probability 0.08 Probability Probability 0.06 0.04 0.04 0.04 0.02 0.02 0.02 0 0 0 29 32 26 26.8 28.3 30.5 27.5 29.8 31.3 7150 7375 7600 7825 8050 8275 8500 8725 8950 9175 1080 1100 1120 1140 1160 1180 1200 1220 1240 Total Project Cost (Current $M) Total Project Cost ($100k) Total Project Cost (Current $10k) 0.4 0.35 0.3 0.25 0.25 0.2 Probability 0.2 0.15 0.15 Probability 0.1 0.1 0.05 0.05 0 0 210 230 250 270 290 310 330 350 1040 1160 1280 1400 1520 1640 1760 1880 Total Project Cost (Current $M) Total Project Cost (Current $k)