Download

1 / 17
250 likes | 691 Views
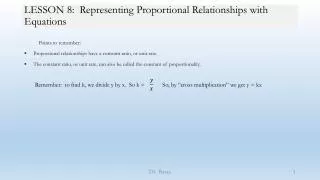
Representing Proportional Relationships. A directly proportional relationship has an equation in the

E N D
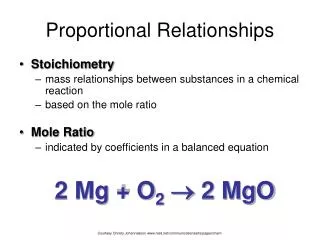
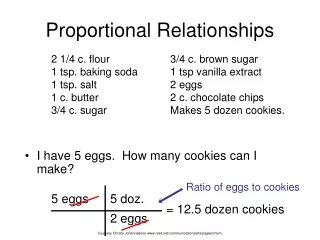
Representing Proportional Relationships A directly proportional relationship has an equation in the form of y=kx. It is a relationship between two quantities in which one is a constant multiple of the other. When one quantity changes, the other changes by a constant factor, k. The constant factor k is the constant of proportionality. Example: Christopher cuts grass (any size yard) for $10.00. How much money would he make if he cut 3 yards? 5 yards? 0 yards?
The function table below shows the relationship between the side lengths of a regular octagon and its perimeter. Step 1: Write an equation to represent the situation. (the perimeter is always 8 times the side length of a regular octagon. So, 8 is the constant of proportionality) P = 8s Step 2: Substitute the side length of 9 for s and find the perimeter. P = 8 x 9 P = 72 in.
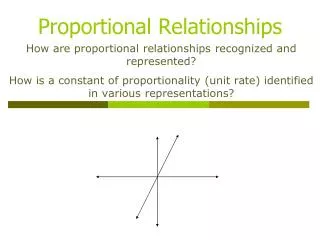
A directly proportional relationship is a linear relationship because it forms a straight line when graphed. The graph of a proportional relationship is a straight line that passes through the origin (0,0). It will also pass through the point (1,k) where k is the constant of proportionality, or the unit rate. Example: An empty swimming pool is being filled at a rate of 10 gallons per minute. Make a graph to display the amount of water in the pool each minute for 6 minutes. Step 1: Write an equation that represents the situation. Let x = the number of minutes and y = the number of gallons y = 10x Step 2: Make a table to show the number of gallons in the pool each minute.
Step 3: Make a line graph, using the ordered pairs in the table.
The graph below shows the amounts charged for purchasing different number roses from a florist. Is there a proportional relationship between the number of roses bout and the cost? If so, what is the constant of proportionality and what does it mean in context? Step 1: Think about the graph of a proportional relationship. Step 2: Determine the constant of proportionality. Step 3: Determine what the constant of proportionality means in context. The relationship is proportional and the constant of proportionality, 2, means that each rose costs $2.
Check it out!! • The table shows the relationship between the side lengths of a regular pentagon and its perimeter. Which equation shows the relationship between the side length and the perimeter of a regular pentagon. • P = s + 5 • P = 5s • P = 1/5s • P = 5s + 5
If the regular pentagon (in the last problem) has side lengths of 8 inches, what is its perimeter? • 13 inches • 30 inches • 40 inches • 45 inches
The graph shows the relationship between the cost of the number of uniforms ordered by a sports team. Which equation shows the relationship between the number of uniforms, x, and the cost, y? • Y = 20x • Y = 10x • Y = 2x • Y = x
What is the unit cost of a uniform in the last problem? • $2 per uniform • $5 per uniform • $10 per uniform • $20 per uniform
Use the information in the last problem to determine how much it will cost the team to order 8 uniforms? • $20 • $140 • $160 • $180