Download
1 / 1
10 likes | 134 Views
Structure and stable isotope systematics of the Farnham Dome, SE Utah P . Benjamin Luetkemeyer, Ethan Shavers 1 & David L. Kirschner 2 1 Saint Louis University, Department of Earth and Atmospheric Sciences, St. Louis, MO

E N D
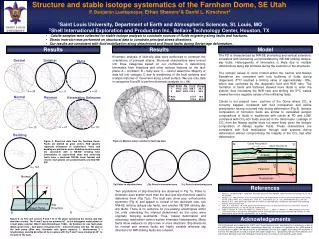
Structure and stable isotope systematics of the Farnham Dome, SE UtahP. Benjamin Luetkemeyer,Ethan Shavers1& David L. Kirschner2 1Saint Louis University, Department of Earth and Atmospheric Sciences, St. Louis, MO 2Shell International Exploration and Production Inc., Bellaire Technology Center, Houston, TX • Calcite samples were collected for stable isotope analysis to constrain sources of fluids migrating along faults and fractures. • Stress inversion was performed on structural data to constrain principal stress directions. • Our results are consistent with fluid mobilization along detachment and thrust faults during Sevier-age deformation. Results Model Results The FD is characterized by NW-SE shortening and vertical extension, consistent with shortening accommodated by NE-SW striking oblique-slip faults. Heterogeneity of kinematics is likely due to multiple deformations along slip surfaces during the evolution of the structures. The isotopic values of veins formed within the Carmel and Navajo Sandstone are consistent with rock buffering of fluids during diagenesis. δ18O reached a limiting value of approximately -18‰, which was controlled by the diagenetic fluid and W/R ratio. The formation of faults and fractures allowed more fluids to enter the system, thus increasing the W/R ratio and shifting the δ13C values toward the more negative values of the infiltrating fluids. Calcite is not present over portions of the Dome where CO2 is currently trapped, consistent with fluid mobilization and calcite precipitation having occurred only during deformation (Fig 8). Isotopic composition of formation fluids are similar to calculated isotopic compositions of fluids in equilibrium with calcite at FD and LGW, consistent with CO2-rich fluids sourced in the Uinta basin. Leakage of CO2 from the Navajo aquifer does not seem likely given the isotopic composition of Navajo aquifer fluids. These observations are consistent with fluid mobilization through fault systems during deformation without compromising the integrity of the CO2 trap after deformation. Kinematic analysis of fault-slip data were performed to constrain the orientations of principal strains. Structural observations were binned into three categories based on our confidence in determining kinematics from lineations and other surface features on the fault plane: A – confident; B – fairly sure; C – cannot determine. Majority of data fall into category C due to weathering of the fault surfaces and multiple histories of movement along a fault surface. We use only data in categories A and B to perform kinematic analysis (n = 44). FaultStrikeDipTrendPlunge 1 076.0 26.5 208.7 20.1 2 298.7 69.9 014.0 63.5 P-Axis 151.4 16.0 T-Axis 013.0 68.9 Sinistral Dextral Veins CO2 Navajo Sandstone n = 25 n = 52 n = 17 Triassic Normal Reverse Kinematics Unknown Bedding Paleozoic Figure 4. Structural data from the Farnham Dome. Faults are plotted as great circles. Red squares represent orientation of slickenlines. Veins and bedding are plotted as poles. Bedding measurements are consistent with a NE-SW trending fold. Orientations of calcite-filled veins and strike-slip faults have a dominant NW-SE trend. Normal and reverse fault planes are predominantly oriented NE-SW. N S Precambrian n = 31 n = 12 n = 111 n = 101 Normal Calcite Precipitation Equity Mounds #3 (7a) Poles to slip-directions (7b) Poles to extension axes (7c) Poles to shortening axes References P T Jurassic Two populations of slip directions are observed in Fig 7a. Poles to kinematic axes scatter more than the fault and slip directions used to determine them (Fig 7b,c). The fault sets show poor orthorhombic symmetry (Fig 4) and appear to consist of two dominant sets, one NW-SE striking oblique-slip faults, and another NE-SW striking dip-slip faults. There is no evidence for pre-existing anisotropies within the units underlying the inferred detachment as the rocks were originally flat-lying sediments. Thus, triaxial deformation and anisotropy reactivation cannot explain kinematic heterogeneity. Many faults show evidence for slip in two or more directions. Slip directions for normal and reverse faults are highly variable whereas slip directions for NW striking faults are coherent. Figure 6. Moment tensor solution to fault-slip data • Marret R., and Allmendinger, 1990, R.W., Kinematic analysis of fault-slip data, Journal of Structural Geology, vol. 12, no. 8, PP. 973-986. • Morgan, C.D., 2008, Structure, reservoir characterization, and carbon dioxide resources of Farnham Dome Field, Carbon County, Utah, in Willis, G.C., Hylland, M.D., Clark, D.L., and Chidsey, T.C., Jr., eds.,UGS Publication 36, p. 297-310. • Neuhaser, K.R., 1988, Sevier-age ramp-style thrust faults at Cedar Mountain, northwestern San Rafael swell (Colorado Plateau), Emery County, Utah. • Twiss, R.J., and Unruh, J.R., 1998, Analysis of fault slip inversions: Do they constrain stress or strain rate?, Journal of Geophysical Research, vol. 103, No. B6, pp. 12205-12222. • Vrolijk, P., Meyers, R., Sweet, M., Shipton, Z., Dockrill B., Evans, J., Heath, J., Williams, A., 2005. Anatomy of reservoir-scale normal faults in central Utah: Stratigraphic controls and implications for fault zone evolution and fluid flow. In: GSA Field Guide 6: Interior Western United States, vol. 6, 261-282. Slip Direction Shear Plane b a Acknowledgements Figure 5. (a) Two unit vectors P and T lie in the plane containing the normal and slip-direction vectors. The P and T axes are oriented 45°to the orthogonal nodal planes of a fault plane solution (Merrit and Almendinger, 1990). (b) Solution for one fault plane (black great circle – fault plane; red great circle – movement plane (see 5a). The pole to the fault plane (Blue dot), kinematic axis (green squares; 1- shortenening 3 – lengthening), and slip direction all lie in a plane with the P and T axes oriented at 45°to the pole to the fault. Part of this project was funded by the AAPG John Teagle Memorial Grant awarded to Ben Luetkemeyer as part of the AAPG Grants-in-Aid program Ben Luetkemeyer would like to express his gratitude to the AAPG board of trustees for their support. We would also like to acknowledge Shell for their support and funding. We would like to thank Dr. Ken McLeod for his kind assistance with stable isotope mass spectrometry. We also thank Michael Laine and Thomas Dempster from Utah Geological Survey for their assistance at Utah Core Research Center.


