Download
1 / 79
790 likes | 873 Views
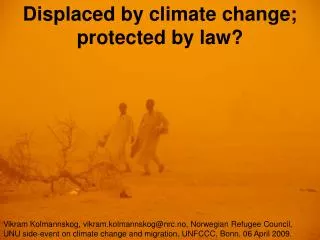
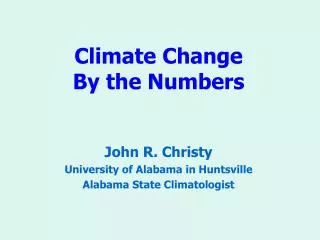
Climate Change By the Numbers. John R. Christy University of Alabama in Huntsville Alabama State Climatologist. Consensus is not Science. Michael Crichton. Consensus is not Science. Michael Crichton. All Science is numbers. William Thompson (Lord Kelvin).

E N D
Climate ChangeBy the Numbers John R. Christy University of Alabama in Huntsville Alabama State Climatologist
Consensus is not Science Michael Crichton
Consensus is not Science Michael Crichton All Science is numbers William Thompson (Lord Kelvin)
Some people will do anything to save the Earth ...except take a science course. Greenhouse “Affect”, Rolling Stone P.J. O’Rourke
The Basic Numbers • Carbon Dioxide has increased 35% • Global Surface temperature rose 0.7 °C in past 100 years • Surface temperature response to 2xCO2 increases (alone) is ~ 1 C • The associated feedbacks are where the uncertainties are large (i.e. no confident numbers)
The Basic Numbers • Humans produce about 7 to 8 gigatons of CO2 (carbon mass) per year mainly from energy production • About 3.5 to 4 gigatons accumulate in the air each year • There are about 740 gigatons of CO2 in the atmosphere • CO2 in the atmosphere is increasing around 0.5% per year
The Basics • Climate is always “changing” • Global temperature is rising or falling • Sea level is rising or falling • Glaciers are retreating or advancing
IPCC SPM Modelers knew the answer ahead of time - not a true scientific experiment. The scientific method requires an independent comparison - i.e. upper air temperatures which modelers in general did not force agreement.
Is Mean Surface Temperature an Appropriate Index for the Greenhouse Effect? TMean = (TMax + TMin)/2 TMean = (Daytime + Nighttime)/2
Day vs. Night Surface Temp Nighttime - disconnected shallow layer/inversion. Temperature affected by land-use changes, buildings, farming, etc. Daytime - deep layer mixing, connected with levels impacted by enhanced greenhouse effect
Night Surface Temp Warm air above inversion Warm air Cold air near surface Buildings, heat releasing surfaces, aerosols, greenhouse gases, etc. can disrupt the delicate inversion, mixing warm air downward - affecting TMin. Nighttime - disconnected shallow layer/inversion. But this situation can be sensitive to small changes such as roughness or heat sources.
No. Alabama Summer TMax Temperatures 1893-2007 Christy 2002, updated to 2007
Mean Surface TemperatureSoutheast USA 1899-2003 Models Observation
MODIS 21 Jul 2002 Jacques Descloitres MODIS Land Rapid Response Team NASA GSFC
Sierras warm faster than Valley in model simulations Snyder et al. 2002
Main Point: Average surface temperatures (average of daytime and nighttime) are poor proxies for greenhouse detection because of nighttime contamination by human development - likely overstating actual atmospheric warming. Models do not replicate past regional temperature well in many places, including the Southeast. • Christy 2002 • Christy et al. 2006 • Pielke, Sr. 2007 • Walters et al. 2007
Vertical Temperature Change due to Greenhouse Forcing in Models Model Simulations of Tropical Troposphere Warming: About 2X surface Lee et al. 2007
Upper Air Tropical Trends Christy and Norris 2006, Christy et al. 2007 Douglass et al. 2007
Global Bulk Atmospheric Temperatures UAH Satellite Data Warming rate 60% of model projections
Main Point: Better proxies (daytime surface temperature and tropospheric temperatures) show only modest changes, and no change in the Southeast, neither of which are reproduced well in models. • Christy and Spencer 2005 • Christy and Norris 2006 • Christy et al. 2007
Total Greenhouse Effect • Water vapor and Clouds Dominate • Total Greenhouse Effect is variable • Climate models show strong water-vapor/cloud positive feedback with increased CO2
Greenhouse Response of Clouds and Water Vapor to Increasing CO2 Negative Feedback? (mitigates CO2 impact) Positive Feedback? (enhances CO2 impact - models)
Tropical Temp. and Cloud Forcing on month-to-month time scalesNegative feedback [Spencer et al. (2007)]Cloud variations act to counter temperature rises(Heat trapping clouds decrease when air is warmed) Cloud Response
• • 2007: Jan-Aug only
Main Point: The most important greenhouse components (clouds and water vapor) are poorly understood and poorly characterized in climate models Spencer et al. 2007 “Models tend to overestimate positive feedback from water vapor …[and] underestimate negative feedback from cloud[s]” Sun et al. 2007. “The low equilibrium climate sensitivity … [is] well below current best estimates ... in the IPCC (2007)” Schwartz 2007.
Arctic Sea Ice Chapman, U.Illinois
North Polar RegionsTemperature HadCRUT3 Satellite Sea Ice Record
AlaskaHadley CRU 3 (°C)Shift in 1977, but high natural variability
When Hemingway writes “Snows of Kilimanjaro”—half of the “snows” are already gone X Mass Gain in 2006 Molg and Kaser 2007
Regional Snowpack, Central Andes, 1951-2005 Masiokas et al. 2006
Antarctica Sea Ice Chapman, U.Illinois
Antarctica Sea Ice Chapman, U.Illinois
Antarctica Thermometers Ice Cores Schneider et al. 2006