Download
1 / 12
120 likes | 249 Views
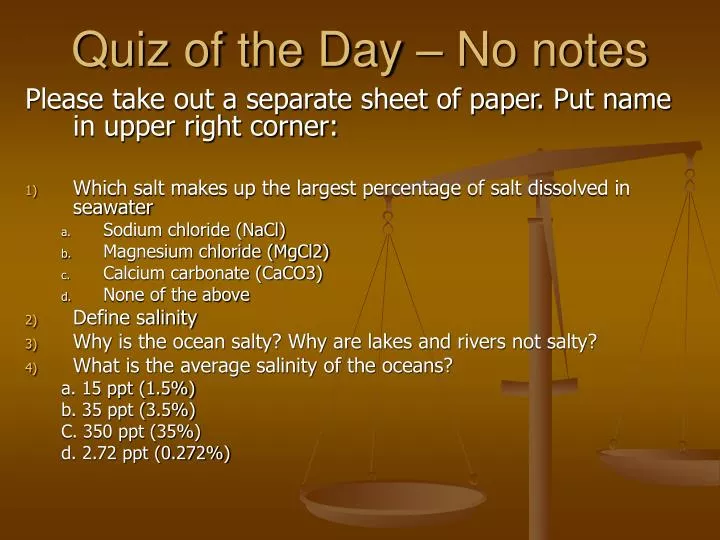
Quiz of the Day – No notes. Please take out a separate sheet of paper. Put name in upper right corner: Which salt makes up the largest percentage of salt dissolved in seawater Sodium chloride (NaCl) Magnesium chloride (MgCl2) Calcium carbonate (CaCO3) None of the above Define salinity

E N D
Quiz of the Day – No notes Please take out a separate sheet of paper. Put name in upper right corner: Which salt makes up the largest percentage of salt dissolved in seawater Sodium chloride (NaCl) Magnesium chloride (MgCl2) Calcium carbonate (CaCO3) None of the above Define salinity Why is the ocean salty? Why are lakes and rivers not salty? What is the average salinity of the oceans? a. 15 ppt (1.5%) b. 35 ppt (3.5%) C. 350 ppt (35%) d. 2.72 ppt (0.272%)
Hydrometer Hydrometer: An instrument used to measure the “relative density” of liquids. “Relative density”: The ratio of the density of a substance to the density of pure water. Pure water is assigned a density of 1. Examples: Wood <1 Metal >1
Make a better Hydrometer On the front table is a variety of supplies to make a better hydrometer. Your mission will be to create a better hydrometer to compare the density of water with varying amounts of salt
Making the hydrometer-materials You will need a piece of graph paper to record your lab design and to record and graph your data for the comparison of density and salinity lab. The following may be used to design your hydrometer: Straws, coffee stirrer, clay (there are different types) tape (to create measurements), ball bearings/bb’s, rubber stoppers
Making the hydrometer Look at the designs of the example hydrometers, think about what might help them work well and what flaws they may have. Make sure that your design includes the following: • You must have a measuring scale on your hydrometer in mm. Use the tape and mark off each mm. Make your 5mm marks longer (so 5mm, 10, 15, 20, etc will be more visible) • The 0 mm. will be at the top of your hydrometer (opposite end of the “bulb”) • Make sure your hydrometer floats upright. The higher your hydrometer floats the greater the density of the liquid in which the hydrometer is floating
Making the hydrometer • Testing your hydrometer • Use 90 ml of water. Place your hydrometer in the water and make sure it floats but that it is low in your water. Add weight if necessary. Make sure the hydrometer remains upright, so that you can easily measure. Make sure you have done the marks in waterproof ink.
Using your hydrometer:Comparing density and Salinity • Fill a 100ml Graduated cylinder with 90 ml of water. Place your hydrometer in the water. • Create a data table. In your data table, record what the water comes to on your mm scale (measure from top down)
Using your hydrometer:Comparing density and Salinity Data Table
Using your hydrometer:Comparing density and Salinity • Remove the hydrometer and mix in 1 g of salt. Replace the hydrometer and record the water level • Repeat step 3 four more times, each time increasing the TOTAL amount of salt to the water. Record the water level each time in the data table • Plot your data on a graph, making sure to label your x and y axis.
Using your hydrometer:Comparing density and Salinity Conclusion: Make sure to include the following in your conclusion: • Why did you design the hydrometer the way you did? Did it float? Were you able to use it to measure density? • What did your data show you about salinity and density? • What general conclusion can you make about increasing salinity in water?
Clean Up • Make sure to rinse your graduated Cylinder and return it to the prep table. • Clean up any spilled salt and wipe down lab space. • Turn in lab papers to Period 4 slot
To be turned in at 9:45am Lab write up with: Two names Sketch of hydrometer Table and Graph Conclusions: • Why did you design the hydrometer the way you did? Did it float? Were you able to use it to measure density? • What did your data show you about salinity and density? • What general conclusion can you make about increasing salinity in water?


![226 Notes - Locke [ 1 ]](https://cdn1.slideserve.com/1715077/226-notes-locke-1-dt.jpg)