Download
1 / 102
1.02k likes | 1.25k Views
HURREVAC 2010. Hurrevac 2010 Training Course. National Hurricane Program. John Eringman COE Charleston District. Email: john.r.eringman@usace.army.mil. Introduction. Hurrevac is a hurricane tracking and evacuation decision tool for G ov’t EMA’s. IT DOES NOT MAKE DECISIONS FOR YOU.

E N D
HURREVAC 2010 Hurrevac 2010 Training Course National Hurricane Program
John Eringman COE Charleston District Email: john.r.eringman@usace.army.mil
Introduction Hurrevac is a hurricane tracking and evacuation decision tool for Gov’t EMA’s IT DOES NOT MAKE DECISIONS FOR YOU
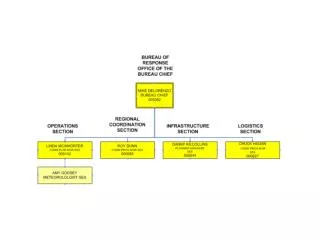
Program Administration • FEMA and USACE funds the program. • A Private contractor (Sea Island Software) writes the program, provides O&M and user support. • It is restricted use software and requires registration to obtain the program. Slide 10
To Register Go To: www.hurrevac.com Click on register
Hurrevac Uses Data from Official Federal Government Agencies
The National Hurricane Center’s • Forecast advisory are issued every 6 hours when storm is being tracked • 2 or 3-hourly intermediate advisories are issued when the storm is near land HURRICANE ADVISORIES
Other Hurrevac DATA Sources River gages & floods - River Forecast Centers Rainfall forecast - Hydro-Meteorological Prediction Center Tide gages – NOAA
DATA FROM FEMA & CORPS Evacuation Clearance times have been calculated for all coastal counties over the last 15-20 years.
Clearance Time Number of hours it takes to get all evacuating vehicles out of the hazard area before Gale force winds arrive in your county. It’s a range of times for different evacuation zones, tourist occupancies and response rates.
4. Hurrevac Procedures for Decision Times NHC Hurricane Advisories PRE-DETERMINED EVACUATION ZONES Evacuation Decision Time Specific Hour Arrival Time of Tropical Storm Force Winds Vehicle Clearance Time in HOURS =
Exploring the NEW Workspace TITLE BAR Version Number
6. Exploring the NEW Workspace TOP FUNCTION BAR also called “Monitoring Ribbon” contains a number of buttons to help manage the program.
6. Exploring the NEW Workspace DATA DISPLAY WINDOW Maps, Text and Reports/Tables
6. Exploring the NEW Workspace allows you to select what you would like to see in the in the Map Tab DATA TREE FOR MAP
6. Exploring the NEW Workspace allows you to customize map features, select reports or tables, use browsers and other utilities. FUNCTIONS TREE
6. Exploring the NEW Workspace Allows you to zoom in and out and pan as well as change the way your storm features appear on the map. MAP TOOLS
6. Exploring the NEW Workspace VIEW TABS the view tabs allow you to save a variety of reports, tables or graphics so they can be quickly viewed by clicking on a tab.
FUNCTION BAR (Monitoring Ribbon) Lets start with the Function Bar and the SETUP button.
DEMO Setup Tabs Slide 29
Current Storms Tab Data Tree The current tab is for active storms. A + sign means there’s storms in that basin. The number in () is how many storms are active Slide 46
Another item in the current TAB is the rainfall forecast. They are issued twice a day, around 8am and 8pm
Each time you turn on the River Gage layer Hurrevac downloads the latest gage information. About 1,000
Gages appear as circles of different sizes and colors depending on the data available. The color legend at the bottom of the screen explains flooding conditions.
At the bottom of the Hurrevac screen is a legend • 5’ Below Flood Stage • Below Flood stage • Minor Flooding • Moderate Flooding • Major flooding • Rising • Falling • Steady Flood Type The outer ring means:
Gages represented by a small white circle have only OLD or OUTDATED data (or no data) Gages with a medium size colored circle have ONLY OBSERVATIONS and no forecast. Gages with a large size colored circle have BOTH OBSERVATIONS and FORECASTS.
When you select a Gage you get this graph. Lets look at the Impacts button
Impacts describe the effects of floods for various stages Lets look at the Crests button
Crests show historic high and low water levels Now the Map Button
shows the 100 year floodplain around the gage and is only available if you downloaded that states gage maps.
Flood outlooks are currently issued once a day and provide a 5 day forecast. The legend at the bottom gives the 3 types of flooding
HURREVAC monitors over 100 coastal tide gages. When you turn them on they are downloaded. Updated every hour.
When you click on a tide gage you’ll see a graph of expected tide and observed tide.
The Save Tides option allows you to save the tide data to your computer.
The archives TAB contains old storm data as well as historic rain, river, tide and flood data. 9. Working with Archive TAB
Favorites heading is intended as a placeholder for frequently used storms. We see how you can copy storms to this area.
The Exercise heading is populated with STM files that are located in a special ExerciseSTMFiles data directory.
The Archives Tab contains storms that have Advisory data stored in them. These go back to 1995 and Andrew in 1992.
Historical plots are for all other historic storms back to 1851 but show only the tracks of the storms. They have no advisory data.
The rain, rivers, tides item under the Archives Tab at the bottom allows you to load old data that you have saved to your hard drive.
View Tabs DEMO Tabs The Map Display window also has Tab features that allow you to look at Advisories, the Tropical Outlook and other reports. When you select the + Tab the report selection window appears.
MAP TOOLS Provide a quick and easy way of changing the appearance of the map and adding additional information.
Zoom Tool - Click-and-Drag zooming Pan Tool - Click-and-Drag panning Extent Button - Left-click for full-extent right-click to zoom to local map. Zoom IN and OUT Buttons - Left-click for 20% zoom in or out, right-click for 40% DEMO
AHEAD BACK AUTO Move Storm AHEAD and BACK – Along the Track Line 1 hour/left-click, 6 hours with right-click. Automate Storm movement along Track NEXT and PREVIOUS Advisory Buttons – Select an advisory from Storm history 1 adv.-left-click, 3 adv.-right-click These work on the Active Storm