Download
1 / 27
270 likes | 433 Views
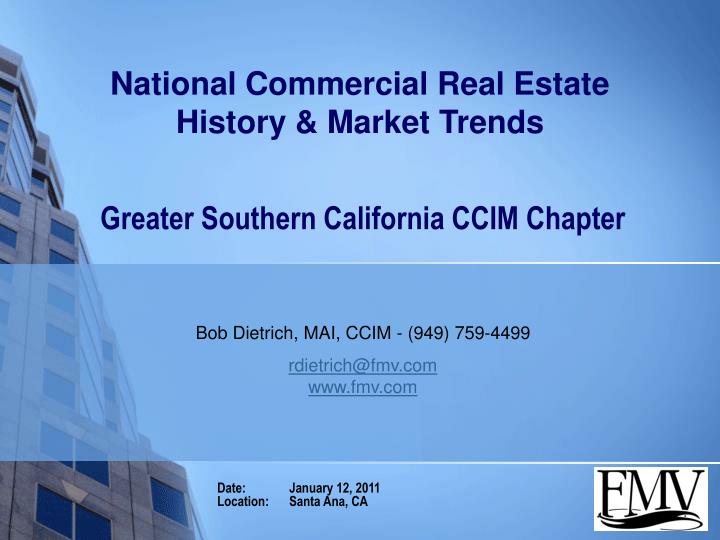
National Commercial Real Estate History & Market Trends. Greater Southern California CCIM Chapter. Bob Dietrich, MAI, CCIM - (949) 759-4499 rdietrich@fmv.com www.fmv.com. Date: January 12, 2011 Location: Santa Ana, CA. OUTLINE. What makes the Commercial Real Estate (“CRE”) market move?

E N D
National Commercial Real Estate History & Market Trends Greater Southern California CCIM Chapter Bob Dietrich, MAI, CCIM - (949) 759-4499 rdietrich@fmv.com www.fmv.com Date: January 12, 2011 Location: Santa Ana, CA
OUTLINE • What makes the Commercial Real Estate (“CRE”) market move? • What happened since market peak and what caused the market movement? • Where are CRE Markets Now? • Where are CRE Markets headed? © FMV Opinions, Inc. 2011
What Moves The Commercial Real Estate Market? • Fundamentals: • Capital structures impact values. Lower mortgage-equity (LTV) ratios means more equity is required to complete deals. Equity is more expensive than debt. • Office and industrial real estate is a house for employees. • Increase in employees means an increased demand for space. • If employment falls, demand falls. When demand falls, rental rates decrease and vacancy increases. © FMV Opinions, Inc. 2011
What Caused Drop in Value? • Financial Issues: • - Lack of capital • - Cost of capital • Market Issues: • - Decreasing market rents • - Increasing vacancy • - Increasing operating expenses • We will look at the impact on commercial real estate during the financial crisis in late 2008 and 2009. Reports have stated value drops of approximately 40%. Is that reasonable? © FMV Opinions, Inc. 2011
Leverage Impact on Cap Rates Cap Rate Comparison – Pre and Post Credit Freeze Cap Rate Prior to Credit Freeze (Spring 2008): Loan: 70% times 7.26% = 5.08% Equity: 30% times 6.50% = 1.95% Total: 100% 7.03% Cap Rate (Rounded): 7.05% Cap Rate After Credit Freeze (Now): Loan: 50% times 7.26% = 3.63% Equity: 50% times 9.00% = 4.50% Total: 100% 8.13% Cap Rate (Rounded): 8.15% Change in Cap Rate: 15.9% Loan Constant 30 amortization, due in 10. Interest rate = 6%. Rates for leased industrial. Assumes no change in vacancy and rent. This shows that credit freeze in late 2008 through 2009 caused an increase in cap rates of about 16% and resulted in a drop in property values of close to the same amount. © FMV Opinions, Inc. 2011
What Happened in Office Market During Financial Crisis? • The office vacancy rate ended 2009 at 17.6%, up from 14.8% at year-end 2008 (Grubb & Ellis), an increase of 19%. Impact on property income was about a 3% drop overall from vacancy change. • Office rental rates dropped 4% according to Grubb & Ellis, but effective rent including free rent and other concessions dropped by 12%. • Inflation in operating expenses continues to increase at near inflation of 2% to 3% (IREM). • The impact on office net income was a drop total of about 18%. © FMV Opinions, Inc. 2011
What Happened in 2009 to Office ValuesCompared to 2008? As shown, the combination of increasing cap rates, increasing vacancy, and decreasing income resulted in a drop of over 40% from pre-financial melt-down values to the end of 2009. © FMV Opinions, Inc. 2011
What About The Industrial Market In 2009? • Similar to offices, Grubb & Ellis showed that average effective rent dropped by 12% in 2009. • Vacancy according to Grubb & Ellis ended 2009 at 10.7%, up sharply from 2008. • Expenses continued to increase. • Similar overall impact on values as the office market nationally. © FMV Opinions, Inc. 2011
Where Are The Markets Heading? • FMV searched nationally in major urban markets for sales of Class A office and Class A and B industrial buildings over 100,000 square feet. • We extracted cap rate and price per square foot information. • We compared prices to employment since mid 1990s to project future trends. Employment data is from Moody’s. • We will first look at health of businesses. They must be healthy for employment to improve. © FMV Opinions, Inc. 2011
What Has Happened With Employers? © FMV Opinions, Inc. 2011
What Has Happened With Employers? © FMV Opinions, Inc. 2011
What Has Happened With Employers?Port of Los Angeles Traffic © FMV Opinions, Inc. 2011
What Has Happened With Employment? © FMV Opinions, Inc. 2011
Office Cap Rates Peaked Fed Starts Easy Money Policies © FMV Opinions, Inc. 2011
Office Values Stabilizing Interesting sale is Hancock Tower in Boston. Sold in 2006 for $1.3 billion, $660 million in 2009 and $930 million at end of 2010. © FMV Opinions, Inc. 2011
When and Where is Office Recovery? © FMV Opinions, Inc. 2011
Flight to Quality © FMV Opinions, Inc. 2011
Industrial Cap Rates Easing Down © FMV Opinions, Inc. 2011
Industrial Values Starting to Recover © FMV Opinions, Inc. 2011
When and Where is Industrial Recovery? © FMV Opinions, Inc. 2011
Flight to Quality © FMV Opinions, Inc. 2011
Clouds on Horizon or Smooth Sailing? • CMBS & commercial mortgage maturities – Can loans maturing be refinanced with lower values and tighter underwriting? • Job growth – When will jobs start to really grow? This is a major component to commercial real estate recovery. • Interest rates – With Fed printing money, what happens when velocity increases? Rates will have to go up, home price affordability drops, real estate values decline. Could the second dip occur? © FMV Opinions, Inc. 2011
Commercial Mortgage Maturity TrendsSource: Foresight Analytics CMBS issuance was © FMV Opinions, Inc. 2011
Commercial Mortgage Maturity Trends New CMBS issuance was up over 50% in 2010. However, the rate of recovery is not enough to handle the projected rate of CMBS maturities. © FMV Opinions, Inc. 2011
FMV Opinions Overview • Valuations from under $1 Million to over $10 Billion • Experience With Public & Private Entities • Experienced Team of Professionals • Staff of Approximately 50 Professionals • Alum From “Big Four”, I-Banks, Houlihan, Business Operations, Commercial Lending • Five Office Locations: • Irvine, San Francisco, New York, Dallas, Chicago • Senior Management Involvement in Each Project • IRS & Court Experience • IRS Audit Rate Well Below Industry Average © FMV Opinions, Inc. 2011
FMV Opinions Overview • Real Estate Valuation Services • Valuation Opinions • Portfolio Evaluation • Estate & Income Tax • Financial Reporting • Workout and lender support • Litigation Support • Extensive court room experience (Robert Dietrich with over 60 appearances in court as an expert witness) • Eminent domain • Bankruptcy © FMV Opinions, Inc. 2011
FMV Opinions Overview • Business Valuation Services • Valuation Opinions • Corporate Planning • M&A, Recaps, Shareholder Buyouts • Estate & Income Tax • Recognized Leader in Estate & Gift • Financial Reporting • Purchase Price Allocations & Option Valuations • Transactional Opinions • Solvency & Fairness • Litigation Support • Valuation & Quantification of Lost Profits & Damages • Partner Dissolution, Buy/Sell © FMV Opinions, Inc. 2011