Download
1 / 16
160 likes | 301 Views
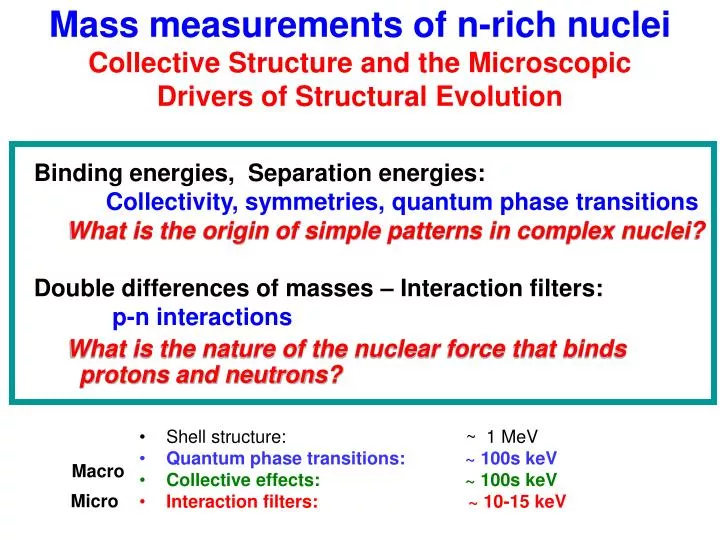
Mass measurements of n-rich nuclei Collective Structure and the Microscopic Drivers of Structural Evolution. Shell structure: ~ 1 MeV Quantum phase transitions: ~ 100s keV Collective effects: ~ 100s keV

E N D
Mass measurements of n-rich nuclei Collective Structure and the Microscopic Drivers of Structural Evolution • Shell structure: ~ 1 MeV • Quantum phase transitions: ~ 100s keV • Collective effects: ~ 100s keV • Interaction filters: ~ 10-15 keV Binding energies, Separation energies: Collectivity, symmetries, quantum phase transitions What is the origin of simple patterns in complex nuclei? Double differences of masses – Interaction filters: p-n interactions What is the nature of the nuclear force that binds protons and neutrons? Macro Micro
Collective contributions to masses can vary significantly for small parameter changes in collective models. Masses: complementary observable to spectroscopic data in pinning down structure. Particularly important far off stability where data will be sparse S2n(Coll.) for two calcs. S2n(Coll.) for two calcs. B.E.(z,c) B.E (MeV) Er Gd Examples of IBA calculations of rare earth nuclei
Microscopic perspective Valence Proton-Neutron Interaction Development of configuration mixing, collectivity and deformation – competition with pairing Changes in single particle energies and magic numbers Partial history: Goldhaber and de Shalit (1953); Talmi (1962); Federman and Pittel ( late 1970’s); Casten et al (1981); Heyde et al (1980’s); Nazarewicz, Dobacewski et al (1980’s); Otsuka et al( 2000’s) and many others.
Measurements of p-n Interaction Strengths Average p-n interaction between last two protons and last two neutrons Vpn (Z,N) = ¼ [ {B(Z,N) - B(Z, N-2)} - {B(Z-2, N) - B(Z-2, N-2)} ] Ref: J.-y. Zhang and J. D. Garrett
126 82 LOW j, HIGH n HIGH j, LOW n 50 82 Orbit dependence of p-n interactions p-n interaction is short range similar orbits give larger p-n interactions Largest p-n interactions if proton and neutron shells have filling fractional filling
Empirical p-n interaction strengths indeed strongest along diagonal. But quantitative microscopic calculations needed Empirical p-n interaction strengths stronger in like regions than unlike regions. New Xe masses (ISOLTRAP/ ISOLDE) Neidherr et al Nazarewicz, Stoitsov, Satula Though DFT gives masses only to ~ 1 MeV, the filter allows us to study subtle, important correlation effects at the 10-30 keV level.
Two regions of parabolic anomalies. Two regions of octupole correlations Possible signature?
Sn – Magic: no valence p-n interactions Critical role of the valence p-n interaction Both valence protons and neutrons NpNn Scheme
Z 82 , N < 126 Z 82 , N < 126 3 1 1 2 3 2 1 82 50 82 126 Z > 82 , N < 126 Z > 82 , N > 126
208Hg 208Hg
p-n interactions and the evolution of structure Direct correlation of observed growth rates of collectivity with empirical p-n interaction strengths
W. Nazarewicz, M. Stoitsov, W. Satula Realistic Calculations Microscopic Density Functional Calculations with Skyrme forces and different treatments of pairing