Download
1 / 25
250 likes | 360 Views
Phosphorus As A Stressor. Alexandra Arntsen, Alison Foster, Scott Ritter April 2011.

E N D
Phosphorus As A Stressor Alexandra Arntsen, Alison Foster, Scott Ritter April 2011
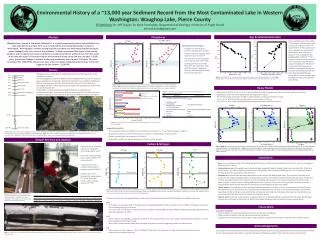
Problem Statement:Excess phosphorus loading in Lake Champlain is affecting overall water quality through increased growth rates of photosynthetic aquatic plant life and the subsequent reduction of dissolved oxygen.
Two types of phosphorus: 1) Soluble Reactive Phosphorus (SRP) - passes through 0.45 micron filter -mostly occurs as dissolved reactive phosphorus that is 100% bioavailable -form taken up by plants 2) Particulate Phosphorus - trapped in 0.45 micron filter - mostly unavailable
Where do we find available SRP? • Also known as orthophosphates or reactive phosphorus, available SRP can be impacted by various factors: • Wastewater and septic system effluent • Fertilizers • Animal waste • Detergents • Impervious surfaces • Industrial discharge • Drinking water treatment • Synthetic materials, such as those used for construction
Source Pathways (exposure) 0 = no exposure, 1 = known exposure, 0.5 = unsure
Agriculture • Comprises 14% of the basin’s land area, contributes 38% of total nonpoint source phosphorus • Sources are: manure, commercial fertilizer runoff from fields, soil erosion, runoff from livestock concentration areas, milk house effluent, livestock access to streams and ponds Photo: LCBP poster series
Urban Sources include: -Roads/dirt on roads-Detergents-Over application of fertilizer-Leaves and grass trimmings Photo: LCBP poster series
Waste Water Treatment Facilities • Mean annual discharge of phosphorus in 2007-2008 was 50.694 mt/yr • 10% of the total phosphorus load
Fisheries • Point sources, including fisheries, contribute 10% to the total phosphorus loading into the lake. • Kingsland Bay State Park has seen discharges of 10 ppb outside of the hatchery
Forested Area • 15% of the average annual nonpoint phosphorus load to Lake Champlain • Approximately only 1%percent of the basin’s commercial forest lands are harvested each year
Industrial Paper Mills • In one of two forms- particulate or SRP • Load reduction technology is expensive and has shown to have a 67% reduction in some areas Landfills • Leaching from metals has been shown to result in phosphrous runoff Waste from an old lumber mill in Willsboro, NY
Parks Phosphorus loading from the use of fertilizers and impervious surfaces View from Oakledge Park, VT
Source Pathways (Impact Filter) 4 = large impact, 2 = less impact, 1= small impact, 0.5 = unsure, 0 = no impact
Habitat Pathways (Exposure Filter) 0 = no exposure, 1 = known exposure, 0.5 = unsure
Shallow Lake Champlain (<6ft.)and Other Lakes and Ponds Source: VT DEC Water Quality Division
Deep Lake Champlain (>6ft.) • Altered shallow water habitat due to loss of aquatic plant diversity results in populations shifts for fish occurring at deeper levels Source: Lake Champlain Ecosystem Assessment
Rivers and Streams • Phosphorus from all sources can enter into rivers and streams • Stationary waters are effected same as shallow water Lamoille River
Wetlands • Wetlands can be both a source and sink for phosphorus. • 300,000 acres of wetlands in basin Wetland in South Hero, VT
Habitat Pathways (Impact Filter) 4 = large impact, 2 = less impact, 1= small impact, 0.5 = unsure, 0 = no impact
Nonpoint source loading from agriculture, urban, and forests by watershed
Limitations • Non-point sources are not broken down often in literature, making them difficult to quantify. • Specific discharge data is not available for many sources outside of WWTPs.
Recommendations • Regulate fertilizer useage • Focus more greatly on BMPs; consider their enforcement is strong enough • Focus on BMPs in agriculture • Reduce impervious cover and reducing stormwater • More BMPs, retention ponds, wetlands, etc.