Download
1 / 18
180 likes | 311 Views
Sören Holmberg Department of Political Science University of Gothenburg December 2008. Voting Behavior in US Presidential Elections. A Graphical Story. US Presidential Election 2008 Preliminary Outcome.

E N D
Sören Holmberg Department of Political Science University of Gothenburg December 2008 Voting BehaviorinUS Presidential Elections A Graphical Story
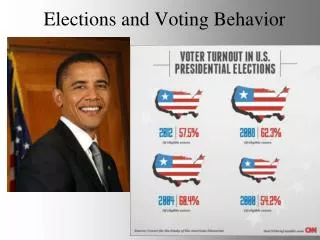
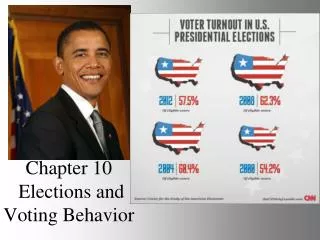
US Presidential Election 2008Preliminary Outcome Estimated Turn-Out: 130 million voters; eligible voters 213 million; turn-out per cent 61.0% Source: Wikipedia
Turn-Out in US Presidential Elections % Source: Stanley and Niemi: Vital Statistics in American Politics. The turn-out figures represent the percentage of the eligible electorate that cast votes in presidential elections. The preliminary result for 2008 is based on a estimate of 130 million casted votes among 213 million eligible voters.
Regional Votingper cent Democrats % North East South Difference North-South -3 -2 +11 +8 +6 +9 +14 +14 +14 Source: VNS Exit Polls; NEP 2004; Edison 2008
Genderper cent Democrats % Women Men Difference Women-Men ±0 +9 +7 +8 +4 +11 +11 +7 +6 Source: VNS Exit Polls; NEP 2004; Edison 2008
Ageper cent Democrats % Under 30 Under 30 60+ 60+ Difference Young-Old +4 +3 +1 -2 -7 +5 -3 +8 +20 Source: VNS Exit Polls; NEP 2004; Edison 2008
Ethnic Groupper cent Democrats % Blacks Hispanic White Difference Black-White +36 +49 +54 +46 +44 +41 +47 +47 +52 Jews 64 45 67 64 80 78 79 74 78 Asians - - - - - - - 56 62 Source: VNS Exit Polls; NEP 2004; Edison 2008
Religionper cent Democrats % Catholics Protestants White Protestants White Born Again Christians Jews 64 45 67 64 80 78 79 74 78 Weekly Church Goers 36 - 39 39 43 Source: VNS Exit Polls; NEP 2004; Edison 2008
Marital Statusper cent Democrats % Unmarried Married Difference +9 +11 +11 +13 +13 +16 +18 Unmarried-Married Source: VNS Exit Polls; NEP 2004; Edison 2008
Gays/Lesbiansper cent Democrats % Source: VNS Exit Polls; NEP 2004; Edison 2008
Incomeper cent Democrats % Under $15 000 $15 000 - $29 000 $100 000 and over Difference Low-High Income +21 +14 +22 +24 Source: VNS Exit Polls; NEP 2004; Edison 2008
Educationper cent Democrats % Post Graduate High School Some College Source: VNS Exit Polls; NEP 2004; Edison 2008
US Party Identification % Democrat Republican Independent 23 23 23 23 30 34 37 34 34 36 38 35 40 39 NEP 2004 Dem 37 Rep 37 Ind 26 Edison 2008 Dem 39 Rep 32 Ind 29 Source: ANES; 1952 - 2004
US IdeologicalSelf-Identification % Liberal Conservative Liberal Conservative Moderate 36 38 38 37 37 37 40 39 40 39 37 39 37 35 37 34 39 35 35 36 36 38 38 37 38 Moderate NEP 2004 Cons 34 Mod 45 Lib 21 Edison 2008 Cons 34 Mod 44 Lib 22 Source: DKs 1 – 6%; General Social Survey, NORC;
US: Independents % Independents plus Leaners Democratic Leaners Republican Leaners Pure 6 9 10 8 11 13 15 13 11 11 12 9 12 10 Independents Independents plus 23 23 23 23 30 34 37 34 34 36 38 35 40 39 Leaners Source: ANES
Ideologyper cent Democrats % Liberals Moderates Conservatives Difference Lib – Cons +42 +37 +53 +62 +50 +58 +63 +70 +69 Source: VNS Exit Polls; NEP 2004; Edison 2008
Party Preferenceper cent Democrats % Democrat Independent Republican Difference Dem – Rep +68 +59 +69 +74 +67 +71 +79 +83 +80 Source: VNS Exit Polls; NEP 2004; Edison 2008