Download
1 / 42
450 likes | 826 Views
Signal Detection Theory. I. Challenges in Measuring Perception II. Introduction to Signal Detection Theory III. Applications of Signal Detection Theory. Part 1. Challenges in Measuring Perception. Psychophysics. Psychophysics is the science of establishing quantitative relations

E N D
Signal Detection Theory I. Challenges in Measuring Perception II. Introduction to Signal Detection Theory III. Applications of Signal Detection Theory
Part 1 Challenges in Measuring Perception
Psychophysics Psychophysics is the science of establishing quantitative relations between physical stimulation and perceptual events.
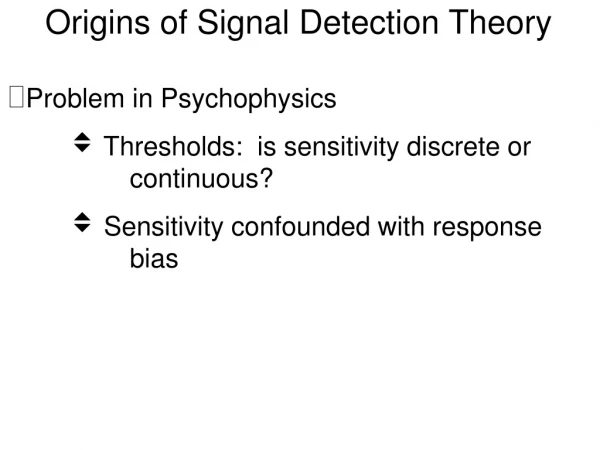
The Method of Limits Experimenter adjusts intensity until the stimulus is detected.
The Method of Limits Advantage: Measurements are made quickly. Disadvantage: It is not clear exactly what’s being measured (no control for bias).
“Catch Trials” The subject is asked to make a response when no stimulus has been presented (also called “noise only” trials).
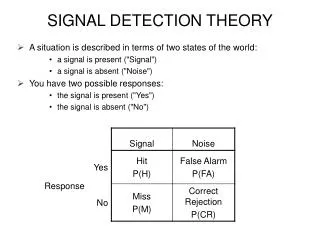
Not All Errors Are Equal 1. Reporting stimulus is present when it’s absent (“false alarm”). Versus 2. Reporting stimulus is absent when it’s present (“miss”).
Correct Responses Differ, Too 1. Reporting stimulus is present when it’s present (“hit”). Versus 2. Reporting stimulus is absent when it’s absent (“correct rejection”).
Stimulus-Response Matrix Correct Rejection False Alarm Absent Stimulus Hit Miss Present “No” “Yes” Response
Part II Introduction to Signal Detection Theory S.D.T. In Words
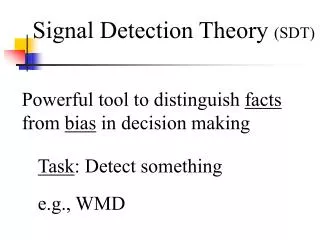
Signal Detection Theory S.D.T. is a procedure for measuring sensitivity to stimulation, independent of the subject’s response bias.
Signal Detection Theory S.D.T. reduces the stimulus-response matrix to two meaningful quantities. 1. Detectability (d’) - a subject’s sensitivity to stimulation. 2. Criterion (b) - a subject’s inclination to favor a particular response; bias.
Part II Introduction to Signal Detection Theory S.D.T. In Pictures
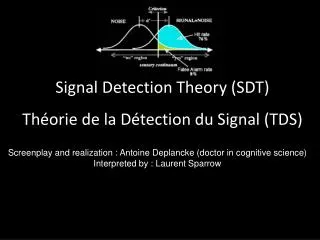
Distributions of Sensory Responses Spontaneous Activity is Constant
Distributions of Sensory Responses Spontaneous Activity is Normally Distributed The “Noise” Distribution
Distributions of Sensory Responses A Mild Stimulus is Presented (d’=1) The “Signal + Noise” Distribution The “Noise” Distribution
Distributions of Sensory Responses A Moderate Stimulus is Presented (d’=2) The “Signal + Noise” Distribution The “Noise” Distribution
Distributions of Sensory Responses An Intense Stimulus is Presented (d’=3) The “Signal + Noise” Distribution The “Noise” Distribution
Distributions of Sensory Responses Sub-Threshold Stimulus is Presented (d’=0) The “Noise” Distribution The “Signal + Noise” Distribution
Criterion The “Noise” Distribution The “Signal + Noise” Distribution
Neutral Criterion The “Noise” Distribution The “Signal + Noise” Distribution .5 .5
Liberal (low) Criterion The “Noise” Distribution The “Signal + Noise” Distribution .2 .6
Conservative (high) Criterion The “Noise” Distribution The “Signal + Noise” Distribution .6 .2
R.O.C. Curves d’=1 d’=0
R.O.C. Curves d’=1 d’=0
R.O.C. Curves d’=2 d’=1 d’=0
R.O.C. Curves d’=3 d’=2 d’=1 d’=0
R.O.C. Curves d’ = -1 d’ = -2 d’ = -3
Part II Introduction to Signal Detection Theory S.D.T. In Numbers
Normal Distributions S.D.T. is based on normal distributions. Each normal distribution is described by a mean and a standard deviation.
Normal Distributions A given point on a normal distribution can be described be described 3 ways. 1. Percentile (also proportion) 2. Z-score (# of standard deviations) 3. Probability Density (likelihood)
Computing Detectability d’ = zHits - zFalse Alarms In excel, the “normsinv” function is used: Input = proportion Output = z-Score Conceptually, detectability (d’) increases with the area under the R.O.C. curve.
Computing Criterion b = Hit Density / False Alarm Density In excel, the “normsdist” function is used: Input = z-Score Output = density Conceptually, b is equal to the slope of the R.O.C. curve at single point.
Part III Applications of Signal Detection Theory
S.D.T. Applications S.D.T. can be used in perceptual discrimination experiments.
S.D.T. And Discrimination The “slow” distribution The “fast” distribution
S.D.T. Applications S.D.T. can be used in non-perceptual research, including memory experiments.
S.D.T. And Memory The “new items” distribution The “old items” distribution