Download

1 / 19
190 likes | 319 Views
Nature of Air Pollution in California. Bart Croes , Chief Research Division bcroes@arb.ca.gov 1-916-323-4519. Unique, Adverse Meteorology Lowest Per Capita Emission Targets.

E N D
Nature of Air Pollution in California Bart Croes, Chief Research Division bcroes@arb.ca.gov 1-916-323-4519
Unique, Adverse Meteorology Lowest Per Capita Emission Targets Onshore circulation pattern, high temperatures, stagnant air masses, and mountain ranges that trap pollutants lead to ... Population Carrying Capacity (VOC+NOX) (million) (tpd) (lb/person/yr) Los Angeles 16.9840 36 San Joaquin Valley4.1 630 69 Houston5.51360 181
Air pollution causes premature deathCalifornia estimates *2006-2008 for PM2.5; 2005 for ozone and TAC Note: 233,00 total deaths in 2010
Cancer risks from airborne toxics*(90% of risk from traffic pollutants) Diesel PM 1,3-Butadiene Hexavalent Chromium Carbon Tetrachloride para-Dichlorobenzene Benzene Perchloroethylene Formaldehyde Acetaldehyde All Others * Estimated 400 cases/year in 2005 (dioxins not included).
Major California control programs • Smoke controls began in 1945 • Backyard burning, open burning at garbage dumps, industrial smoke • Hydrocarbon controls begin in 1956 • Gasoline storage tanks and trucks • 1970s • Industrial SOX controls • Lead and RVP limits for gasoline • Three-way catalysts for passenger cars • 1980s • On-board diagnostics • Low-sulfur gasoline and diesel • 1990s • Air toxics • 2000s and beyond • Light trucks meet same standards as cars • Diesel PM and NOX • Greenhouse gases
Ozone trends in Los Angeles Peak 1 Hr Ozone State Standard Exceedances Stage 1 Alerts (0.20 ppm) Stage 2 Alerts (0.35 ppm)
Ozone trends in California San Diego San Joaquin Valley San Francisco Bay Area California Standard
Nitrates and organics dominate California PM2.5 (because of low sulfur emissions)
PM2.5 exposures across California 1987 2006 1999
As PM2.5 declined, has life expectancy increased? • Overall change in U.S. (1980 to 2000) 2.7 years improvement (health care, lifestyle, diet) • For every decrease of 10 µg/m3 PM2.5 0.61 (± 0.20) years improvement • Reductions in PM2.5 accounted for 15% of U.S. life expectancy improvement Pope et al. (2009) Fine particulate air pollution and life expectancy in the United States, New England Journal of Medicine, 360: 376-386.
In-vehicle exposures can dominate • In-Vehicle = Centerline > Roadside >> Ambient • Examples of in-vehicle-to-ambient ratios • Benzene: 4-8 times higher, 15-20% of total exposure (LA)1 • Diesel: 5-15 times higher, 30 -55% of total exposure (CA)2 • 1,3-Butadiene: 50 to 100 times higher3 • Location of emissions matter • Exhaust high and at front of leading vehicle produces 5 times less in-vehicle impacts than exhaust low and at rear of vehicle 1Rodes, et al. (1998) 2Fruin, et al. (2004) 3Duffy and Nelson (1997)
Costs of Control 0.5% GDP (US 1990-2020) Benefits of Control $10-95 in health benefits for each $1 of control (US 1970-1990) $30 in health benefits for each $1 of control (US 1990-2020)* Air pollution control industry – 32,000 jobs and $6.2B (CA 2001) Clean energy industry – 123,000 jobs and $27B (CA 2009) U.S. EPA Reports to Congress on The Benefits and Costs of the Clean Air Act (www.epa.gov/air/sect812/index.html) * 1990-2020 uncertainty analysis under development
Summary • California per capita emissions must be lowest in U.S. • Current air pollution health risk • PM2.5 >> ozone > air toxics • Emissions control focus • 1950s and 1960s: smoke • 1970s and 1980s: lead, SOX, hydrocarbons and NOX • 1990s to present: diesel PM and NOX, air toxics, GHG • Air quality improved 75-90% despite growth • On-road controls have greatest benefits • Benefits much greater than control costs
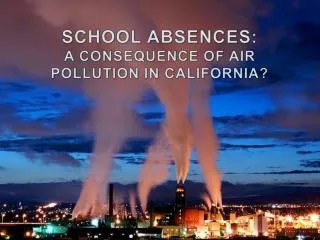
California’s air pollution problem Unique geography and meteorology confine air pollutants Over 90% of Californians breathe unhealthy air 38 M people 90 people per km2 24 M gasoline cars 1.3 M diesel vehicles 1.4 B km per day 18 M off-road engines 3 large container ports
Air pollution reduced 75-90% despite growth Carbon Monoxide Nitrogen Dioxide Sulfur Dioxide Population Number of Vehicles Vehicle Miles Ozone – Los Angeles peak reduced 70%, hours of exposure by 90% PM10 – annual-average levels reduced 75% Air toxics – lead eliminated, cancer risk reduced 80% (since 1989) Black carbon – reduced 90% (95% by 2020)
Study of U.S. truckingindustry Compared with U.S. population: • All-cause death rate: • 28% lower However: • Heart disease death rate: • Drivers 49% higher • Dockworkers 32% higher • Lung cancer death rate: • Drivers 10% higher • Dockworkers 10% higher Laden, et al. (2007) Cause-specific mortality in the unionized U.S. trucking industry, Environmental Health Perspectives, 115:1192-1196.