Download
1 / 19
190 likes | 287 Views
EXISITNG OPERATING RULES OF MAJOR DAMS BUILT INTO WATER RESOURCES YIELD MODEL FOR THE LETABA RIVER SYSTEM 31 October 2013 INFORMATION WORK SESSION Presented by: Pieter van Rooyen. Major Dams focussed on. Dap Naude Ebenezer Magoebaskloof & Vergelegin Hans Merensky Tzaneen Thabina

E N D
EXISITNG OPERATING RULES OF MAJOR DAMS BUILT INTO WATER RESOURCES YIELD MODEL FOR THE LETABA RIVER SYSTEM 31 October 2013 INFORMATION WORK SESSION Presented by: Pieter van Rooyen
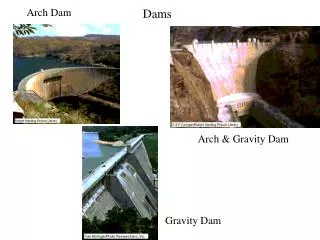
Major Dams focussed on • Dap Naude • Ebenezer • Magoebaskloof & Vergelegin • Hans Merensky • Tzaneen • Thabina • MiddelLetaba • Nsami • Modjaji
Location of Damson schematic diagram:Upper Letaba 1 Dap Naude Ebenezer Georges Valley Canal Pusela Canal
Magoebaskloof Location of Damson schematic diagram:Upper Letaba 2 Hans Merensky Vergelegin Tzaneen Thabina Noord Canal NN Canal
Location of Dams on schematic diagram: Middle Letaba Nsami Canal MiddelLetaba
Location of Dams on schematic diagram: Lower GrootLetaba Modjaji
DAP NAUDE • Current court order: 0.028 m3/s released from November to June, with the full inflow to the dam being released in August, September & October • Present day simulated 0.028 m3/s all year round • No support to Ebenezer • Current abstraction: Polokwane: 4.07 mill m3/a (gauge: B8R006) Present Day simulated Court order
EBENEZER • Rule: no support to Tzaneen BUT reality shows different 2 release events from Ebenezer when Tzaneen Dam low
EBENEZER • To simulate closer to observed, built in rule to support Tzaneen when Tzaneen drops below 15% No support to Tzaneen Tzaneen Ebenezer With support to Tzaneen Tzaneen Ebenezer
EBENEZER DEMANDS & RESTRICTIONS • Directly from dam: Polokwane: 16.2 million m3/a (Gauge B8R001) • Irrigation: • Releases for Georges Valley Canal: 2.54 million m3/a • Releases for Pusela Canal: 7.00 million m3/a • Releases for Main stem: 1.85 million m3/a • Total: 11.4 million m3/a • Irrigators restricted based on Tzaneen Dam operating rule and levels AND 0 allocation when Ebenezer < 20% • Urban 70% allocation when Ebenezer < 20%
MAGOEBASKLOOF & VERGELEGIN • Measured canal outflow from Magoebaskloof, 4.6 million m3/a (gauge: B8R003) • Irrigation for tea plantation greatly reduced from allocation for present day run • Abstraction from Vergelegin for Industry and town = 2.16 million m3/a, given priority Magoebaskloof Vergelegin
HANS MERENSKY • No support to Tzaneen • Only irrigation demand from dam, 4.5 million m3/a
TZANEEN DEMANDS AND RULE • Rule: below 95% irrigators cut to 50% allocation, reviewed incrementally as dam recovers above 95% • Below 15% irrigators get 0%, urban cut to 70% • Irrigation: • NoordKanaal: 28.8 million m3/a • N&N Kanaal: 13.03 million m3/a • Main River Tzaneen: 27.85 million m3/a • Total: 69.68 million m3/a • 0.6 m3/s must pass Letaba Ranch, released from Tzaneen when incremental insufficient • Urban demands: Tzaneen town, Ritivi 1 & 2, BaPhalaborwa: 12.4 million m3/a
Tzaneen Dam simulated With restriction rule No restriction rule
MIDDEL LETABA • Releases through canal to Nsami Dam as per measurements (gauge B8R007) 18.3 million m3/a • Abstraction and losses from canal calculated from measurements (gauge B8R007 - B8H067): 16.8 million m3/a • Urban abstraction from dam: 2.7 million m3/a
NSAMI • Urban abstraction from dam: 2.8 million m3/a
MODJADJI • Urban abstraction from dam: 2.9 million m3/a
THABINA • Urban abstraction from dam: 2.8 million m3/a