Download
1 / 1
10 likes | 123 Views
Application of Wavelet Analysis on De-striping the MODIS Infrared Band Radiance Measurements. Jun Li 1 , Zhongdong Yang 1 , W. Paul Menzel 2 , and H.-L. Huang 1 1 Cooperative Institute for Meteorological Satellite Studies (CIMSS), UW-Madison 2 NOAA/NESDIS/ORA Madison, Wisconsin.

E N D
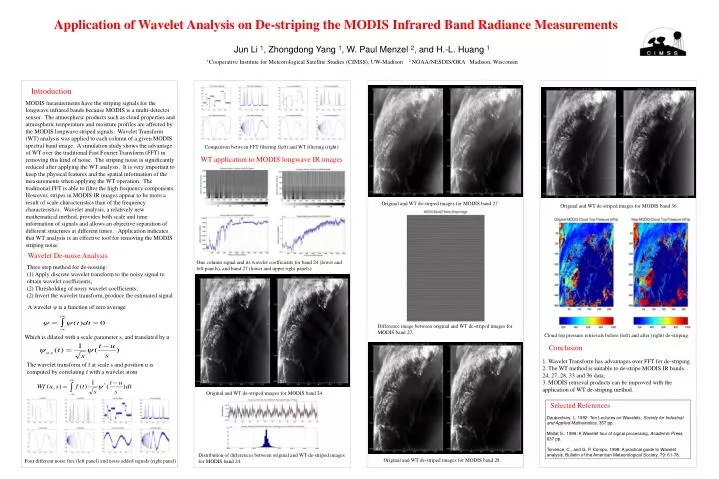
Application of Wavelet Analysis on De-striping the MODIS Infrared Band Radiance Measurements Jun Li 1, Zhongdong Yang 1, W. Paul Menzel 2, and H.-L. Huang 1 1 Cooperative Institute for Meteorological Satellite Studies (CIMSS), UW-Madison 2 NOAA/NESDIS/ORA Madison, Wisconsin Introduction • MODIS measurements have the striping signals for the longwave infrared bands because MODIS is a multi-detector sensor. The atmospheric products such as cloud properties and atmospheric temperature and moisture profiles are affected by the MODIS longwave striped signals. Wavelet Transform (WT) analysis was applied to each column of a given MODIS spectral band image. A simulation study shows the advantage of WT over the traditional Fast Fourier Transform (FFT) in removing this kind of noise. The striping noise is significantly reduced after applying the WT analysis. It is very important to keep the physical features and the spatial information of the measurements when applying the WT operation. The traditional FFT is able to filter the high frequency components. However, stripes in MODIS IR images appear to be more a result of scale characteristics than of the frequency characteristics. Wavelet analysis, a relatively new mathematical method, provides both scale and time information of signals and allows an objective separation of different structures at different times. Application indicates that WT analysis is an effective tool for removing the MODIS striping noise. Comparison between FFT filtering (left) and WT filtering (right). WT application to MODIS longwave IR images Original and WT de-striped images for MODIS band 27. Original and WT de-striped images for MODIS band 36. Wavelet De-noise Analysis One column signal and its wavelet coefficients for band 24 (lower and left panels), and band 27 (lower and upper right panels). Three step method for de-noising: (1) Apply discrete wavelet transform to the noisy signal to obtain wavelet coefficients; (2) Thresholding of noisy wavelet coefficients; (2) Invert the wavelet transform, produce the estimated signal. A wavelet ψ is a function of zero average Difference image between original and WT de-striped images for MODIS band 27. Cloud top pressure retrievals before (left) and after (right) de-striping. Which is dilated with a scale parameter s, and translated by u Conclusion 1. Wavelet Transform has advantages over FFT for de-striping. 2. The WT method is suitable to de-stripe MODIS IR bands 24, 27, 28, 33 and 36 data; 3. MODIS retrieval products can be improved with the application of WT de-striping method. The wavelet transform of f at scale s and position u is computed by correlating f with a wavelet atom Original and WT de-striped images for MODIS band 24. Selected References Daubechies, I., 1992: Ten Lectures on Wavelets, Society for Industrial and Applied Mathematics, 357 pp. Mallat S., 1999: A Wavelet tour of signal processing, Academic Press, 637 pp. Torrence, C., and G. P. Compo, 1998: A practical guide to Wavelet analysis, Bulletin of the American Meteorological Society, 79: 61-78. Distribution of differences between original and WT de-striped images for MODIS band 24. Original and WT de-striped images for MODIS band 28. Four different noise free (left panel) and noise added signals (right panel)