Download
1 / 21
210 likes | 331 Views
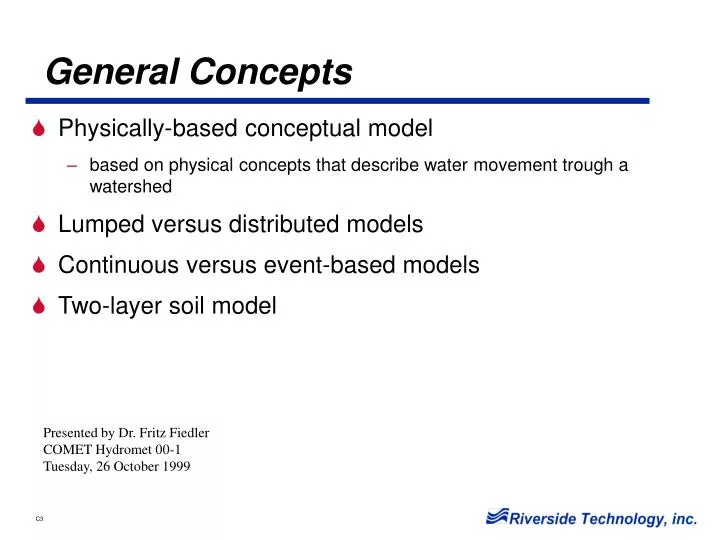
General Concepts. Physically-based conceptual model based on physical concepts that describe water movement trough a watershed Lumped versus distributed models Continuous versus event-based models Two-layer soil model. Presented by Dr. Fritz Fiedler COMET Hydromet 00-1

E N D
General Concepts • Physically-based conceptual model • based on physical concepts that describe water movement trough a watershed • Lumped versus distributed models • Continuous versus event-based models • Two-layer soil model Presented by Dr. Fritz Fiedler COMET Hydromet 00-1 Tuesday, 26 October 1999
Design Considerations • Conceptual approach provides means to assess changes in watershed morphology • Detailed modeling of the many actual watershed processes was too complex for operational application • Detailed modeling required more data than available • System developed that integrates primary physical processes without excessive data and/or computational needs • Essentially based on basic water balance equation: Runoff = Rainfall - Evapotranspiration - Soil Moisture Changes
Sacramento Soil Moisture Accounting Model • Represents soil moisture characteristics such that: • Applied moisture is distributed in a physically realistic manner within the various zones and energy states in soil • Rational percolation characteristics are maintained • Streamflow is simulated effectively
Sacramento Model Components • Tension water • Free water • Surface flow • Lateral drainage • Evapotranspiration • Vertical drainage (percolation)
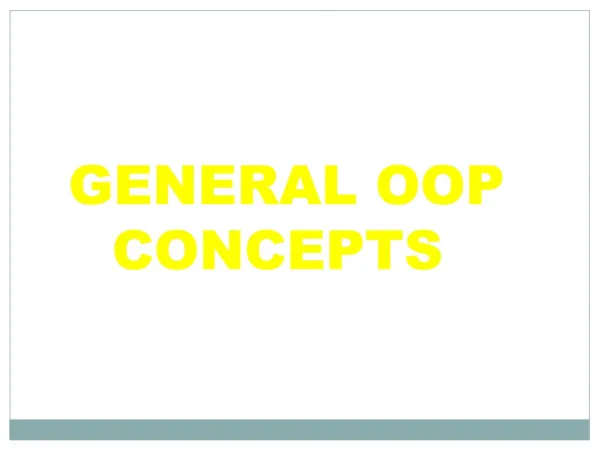
Sacramento Model Structure E T Demand Precipitation Input Px Impervious Area E T Direct Runoff PCTIM ADIMP Pervious Area Impervious Area Upper Zone Surface Runoff EXCESS Tension Water UZTW Free Water UZFW E T UZK Interflow E T Percolation Zperc. Rexp Total Channel Inflow Distribution Function E T RIVA Streamflow 1-PFREE PFREE Lower Zone Free Water Tension Water P S LZTWLZFP LZFS RSERV Supplemental Base flow LZSK E T Total Baseflow LZPK Primary Baseflow Side Subsurface Discharge
Model Parameters PXADJ Precipitation adjustment factor PEADJ ET-demand adjustment factor UZTWM Upper zone tension water capacity (mm) UZFWM Upper zone free water capacity (mm) UZK Fractional daily upper zone free water withdrawal rate PCTIM Minimum impervious area (decimal fraction) ADIMP Additional impervious area (decimal fraction) RIVA Riparian vegetation area (decimal fraction) ZPERC Maximum percolation rate coefficient REXP Percolation equation exponent LZTWM Lower zone tension water capacity (mm) LZFSM Lower zone supplemental free water capacity (mm) LZFPM Lower zone primary free water capacity (mm) LZSK Fractional daily supplemental withdrawal rate LZPK Fractional daily primary withdrawal rate PFREE Fraction of percolated water going directly to lower zone free water storage RSERV Fraction of lower zone free water not transferable to lower zone tension water SIDE Ratio of deep recharge to channel baseflow ET Demand Daily ET demand (mm/day) PE Adjust PE adjustment factor for 16th of each month
State Variables ADIMC Tension water contents of the ADIMP area (mm) UZTWC Upper zone tension water contents (mm) UZFWC Upper zone free water contents (mm) LZTWC Lower zone tension water contents (mm) LZFSC Lower zone free supplemental contents (mm) LZFPC Lower zone free primary contents (mm)
Percolation Rate Under Saturated Conditions • Water balance of lower zone In Lower zone Out
Percolation Rate Continued... • Water balance of lower zone In Out
Percolation Characteristics • PBASE • The continued percolation rate under saturated conditions • A function of the lower zone capacities and the lower zone withdrawal rates • PBASE = LZFSM • LZSK + LZFPM • LZPK • ZPERC • The number of PBASE units that must be added to the continuing saturated percolation rate to define the maximum percolation rate • REXP • The exponent which defines the curvature in the percolation curve with changes in the lower zone soil moisture deficiency.
Effect of Soil-Moisture Parameters on Model Response • Volume • Altering these parameters changes volume, but not the relative breakdown of runoff among various non-impervious components • UZTWM, LZTWM, ET (Demand curve), PE (Adjustment curve) • Timing • Altering these parameters changes the relative breakdown of runoff between various non-impervious components; always causes timing changes and (in some cases) can cause significant overall volume changes • UZFWM, LZFPM, LZFSM, UZK, LZPK, LZSK, ZPERC, REXP
Effect of Soil-Moisture Parameters on Model Response (continued) • Impervious runoff • Altering these parameters determines how much of the rain + melt goes directly to runoff; both have a volume and timing effect, though PCTIM mainly affects volume, and ADIMP primarily affects timing • PCTIM, ADIMP • Baseflow volume • Altering these parameters primarily changes the amount of baseflow volume while having little or no effect on other runoff components • SIDE, RIVA, PFREE • Minor effect • Generally has little effect on model response • RSERV
Sacramento Model Structure E T Demand Precipitation Input Px Impervious Area E T Direct Runoff PCTIM ADIMP Pervious Area Impervious Area Upper Zone Surface Runoff EXCESS Tension Water UZTW Free Water UZFW E T UZK Interflow E T Percolation Zperc. Rexp Total Channel Inflow Distribution Function E T RIVA Streamflow 1-PFREE PFREE Lower Zone Free Water Tension Water P S LZTWLZFP LZFS RSERV Supplemental Base flow LZSK E T Total Baseflow LZPK Primary Baseflow Side Subsurface Discharge
Evapotranspiration • ET Demand: Evapotranspiration from land surface when soil moisture is not limiting (tension water at capacity) • Potential Evaporation: Evaporation from free water surface (lakes, wet grass) • PE Adjustment Curve: Seasonal curve reflecting type and activity of vegetation ET Demand = PE * PE Adjustment
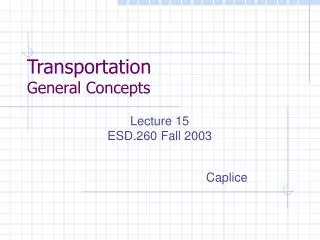
Hydrograph Produced Mainly by Surface Runoff (Runoff Breakdown: Surface 64%, Interflow 15%, Supplemental 21%)
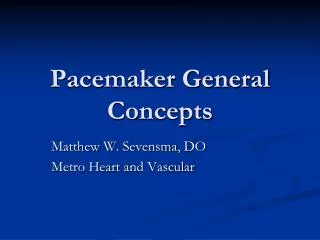
Hydrograph Produced by Mixed Runoff( Runoff Breakdown: Surface 27%, Interflow 33%, Supplemental 40%)
Hydrograph Containing No Surface Runoff(Runoff Breakdown: Interflow 17%, Supplemental 83%)