Download
1 / 29
310 likes | 575 Views
Cost Functions. ECN741 , Urban Economics Professor Yinger. Cost Functions. Class Outline Cost Functions and Production Functions The Bradford/Malt/Oates Framework Issues in Estimating Cost Functions. Cost Functions. Cost Functions Production functions lead to cost functions.

E N D
Cost Functions ECN741, Urban Economics Professor Yinger
Cost Functions Class Outline • Cost Functions and Production Functions • The Bradford/Malt/Oates Framework • Issues in Estimating Cost Functions
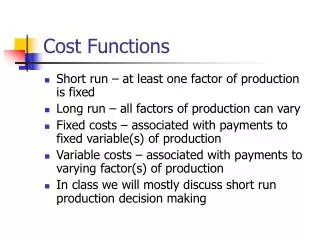
Cost Functions Cost Functions • Production functions lead to cost functions. • Production functions indicate the maximum output at a given level of inputs. • Cost functions indicate the minimum spending required to produce a given output at given input prices. • Both assume maximizing behavior.
Cost Functions Which is the Best Approach? • Although they both shed light on the technology of public production, cost functions and production functions have different strengths and weaknesses for empirical analysis. • You have to figure out the best approach given the question you want to answer and the data that are available to you.
Cost Functions Cost Functions in Education • Cost functions are ideal at the school district level, where spending and output are observed. • A cost function, unlike a production function, can include many outputs. • Many public policies, such as state aid, are linked to the district level, so district-level cost studies link directly to policy.
Cost Functions Cost Functions in Education, 2 • Cost functions do not work well for other scales, however. • It is not possible to estimate cost functions at the individual or classroom level because the dependent variable, spending, is unavailable (and even hard to define). • Studies of school level cost functions run into serious endogeneity problems without obvious instruments.
Cost Functions District Production Functions in Education • As we have seen, production functions work well with student-level data. • Several studies use classroom data. • They do not work well at the school or district level, however, because many inputs (e.g. counseling) cannot be observed.
Cost Functions District Production Functions in Education, 2 • Hanushek has argued (in presentations at AEFP and, with co-authors, in the Peabody Journal of Education (2008)) that one can estimate production functions with “spending” as the input. • Using this approach, he finds that spending does not affect performance. • Bill and I disagree. • The assumption that spending is the input, implies that any equal-cost combination of inputs yields the same performance. • Spending includes inefficiency, so this approach has a huge errors-in-variables problem. • See our article in the Peabody Journal in 2011.
Cost Functions B/M/O Framework • Research on public cost functions builds on a framework first proposed by in a famous 1969 NTJ article by Bradford, Malt, and Oates. • They model government production in two stages and argue that “environmental” conditions, defined below, play a big role. • They show that these conditions need to be considered in any cost function estimation.
Cost Functions B/M/O Framework, 2 • B/M/O start with a 1st-stage production function for intermediate outputs (their direct or D-outputs): • Then G goes into a 2nd-stage production function for final outputs (their consumed or C-outputs).
Cost Functions B/M/O Framework, 3 • The first stage is similar to private production. Police patrol hours (G) as a function of police officers (L) and police cars (K), for example. • But what people really care about is the final output (S), such as protection from crime. • The key insight is that the production of S depends on the environment (N) in which it is produced.
Cost Functions B/M/O Framework, 4 • Examples of “Environment” • Police: Poor people are more likely to be victims of crime and to be desperate enough to turn to crime, • Fire: Old houses catch fire more often and burn faster; fire spreads faster when housing is closely packed. • Education: Children from poor families are more likely to bring health or behavioral problems to school, and less likely to have lessons reinforced at home.
Cost Functions B/M/O Framework, 5 • Adding input prices (P) and a random error (ε) leads to the 1st-stage cost function: • Now insert the inverted 2nd-stage production functions: • To get the 2nd-stage cost function:
Cost Functions Duncombe/Yinger Issues • Bill and I suggest that cost-function studies should address 5 key questions. • What is the output? • What is the best way to account for inefficiency? • What student traits should be included? • How should the endogeneity of output and wages be handled? • What is the best functional form?
Cost Functions Picking the Output • Public services are often complex and output measures are often difficult to find. • Fire: Probability of fire and loss from a fire. • Education: Test scores (what grade? what test?), graduation rate (based on what cohort?),….
Cost Functions Accounting for Efficiency • Cost is defined as minimum possible spending or spending using best practices. • We only observe actual spending, which also reflects deviations from best practices = deviations from efficiency (e = 1). • Thus, a more accurate formulation is
Cost Functions Accounting for Efficiency, 2 • Some perspective: • e depends on S . • There is no such thing as efficiency in general—only in efficiency in producing a specified S . • If Sis defined as math and English scores, a school district that provides extensive science, social studies, art, and music may be judged to be efficient. • If Sis defined as music contest victories, school districts with great math and English scores may be judged inefficient. • A wasteful district may be judged inefficient in everything, but waste is only a subset of inefficiency.
Cost Functions Accounting for Efficiency, 3 • The problem: • ecannot be directly observed. • Several methods are available. • Include variables that determine e(example below). • Use data envelopment analysis (e.g. D/Y, NTJ, June 1998) • Use stochastic frontiers analysis (e.g. Gronberg, Janson, and Taylor, PJE, 2011).
Cost Functions Student Traits • Many student traits might affect costs, including: • Coming from a family below the poverty line, • Speaking English as a second language, • Being an immigrant, • Having special needs. • Enrollment also matters; most studies find a U-shaped link between enrollment and costs.
Cost Functions Cost Indexes and Pupil Weights • In some applications (including the demand models considered later in the class), it is helpful to have a cost index for each district. • Cost indexes are equivalent (exactly in some cases) to pupil weights plus a teacher-cost adjustment. • This is our next topic.
Cost Functions Functional Form • Most Studies Use • But a few studies use trans-log or some other fancier method; these methods require larger sample sizes than are generally available.
Cost Functions Endogeneity • Performance is endogenous because it is a product of the same set of decisions (and unobserved district traits) as is spending. • Teacher wages are endogenous because they may reflect unobserved district traits that affect both bargaining and spending.
Cost Functions Endogeneity, 2 • Instruments for performance are difficult to come by. • Bill and I draw on the “copy-cat” or “yardstick” theory, which is that districts are influenced by the decisions of similar districts. • Our instruments are exogenous characteristics of comparison districts. • We do not use choices by comparison districts because the copy-cat theory says causation runs in both directions! • We do not use traits of neighboring districts, because these traits might reflect household sorting across districts in response to performance. • Some other scholars use the number of districts or the presence of private schools as indicators of competition.
Cost Functions Endogeneity, 3 • Instruments for wages are not so difficult to find. • First, make the wage variable comparable across districts by controlling for teacher experience. • Use starting wages or wages at a certain level of experience. • Then use some measure of private sector wages as a control. • Private sector wages in a particular sector or occupation roughly comparable to teaching. • Metropolitan area population, which clearly affects wages.
Cost Functions Example: D/Y 2011 • A study of school districts in California. • Data for 2003-04 and 2004-05 are pooled. • District fixed effects are not included because there is not enough over-time variation to estimate the model’s coefficients.