Download
1 / 10
100 likes | 238 Views
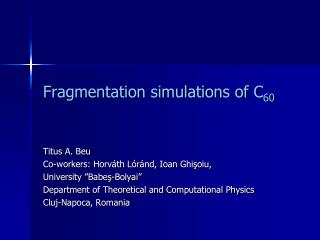
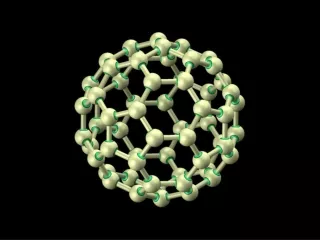
Pump-probe measurements of C 60. Hannover, Germany March 2003. M. Boyle, K. Hoffmann, C.P.Schulz & I.V. Hertel. Eleanor Campbell, Göteborg University & Chalmers, Sweden. 3 ± 0.4 photons @ 400 nm. 5 ±0.7 photons @ 800 nm. 8. IP=7,58eV. 7. 6. Energy [eV]. 5. 4. S 2. 1 T 1u.

E N D
Pump-probe measurements of C60 Hannover, Germany March 2003 M. Boyle, K. Hoffmann, C.P.Schulz & I.V. Hertel Eleanor Campbell, Göteborg University & Chalmers, Sweden
3 ± 0.4 photons @ 400 nm 5 ±0.7 photons @ 800 nm 8 IP=7,58eV 7 6 Energy [eV] 5 4 S2 1T1u 3 S1 2 1T1g 1 1Ag S0 0 Experimental Introduction JCP 112 (2000) 2781 Photo-electron and Photo-ion spectroscopy to study C60 Energy Redistribution Excitation and ionization mechanisms Recent interest lies in the 4-photon with 800nm (or 2-photon with 400nm) transition, where Rydberg Series have been observed
IP Photoelectron Spectra of C60 BE=hn-KE Boyle, et al. PRL 87 (2001)273401 assuming 1 photon
Bandwidth Limited Pulse Duration DE*Dt=0.441 DEmeas = DElaserDEdecay~DElaser DEradiative decay << DElaser Lifetimes of Rydberg states are 400 fs or longer
Electron MCP Detector time 0 t t Two Color Measurements • Defocused 400nm beam (to equalize focal lengths) • Orientation of polarization so that directly excited electrons from • different colors independently measured • Scanned red pulse in time Polarization Orientation Time Orientation
t t Two Color Pump-Probe: Electrons Rydberg Peaks
Decay Time of Rydberg Series Increasing KE higher Rydberg level longer lifetime slower decay
8 8 8 IP=7.58eV IP=7.58eV 7 7 7 6 6 6 Energy [eV] 5 5 5 Energy [eV] 4 4 4 S2 S2 S2 3 3 3 2 2 S1 S1 S1 2 1 1 1 S0 S0 S0 0 0 0 hu->t1g Dipole allowed:S0S2 Two Color Experimental Summary Measurement was sensitive to 800nm electrons and not 400 nm electrons (due to polarization orientation) Apparent decay of Rydberg levels on few hundred femtosecond time scale
Next Experimental Steps 1.) Different Wavelengths (avoid lower resonance) 2.) PEPICO - to correlate electron to ion 3.) angular distribution of electrons