Download
1 / 15
150 likes | 227 Views
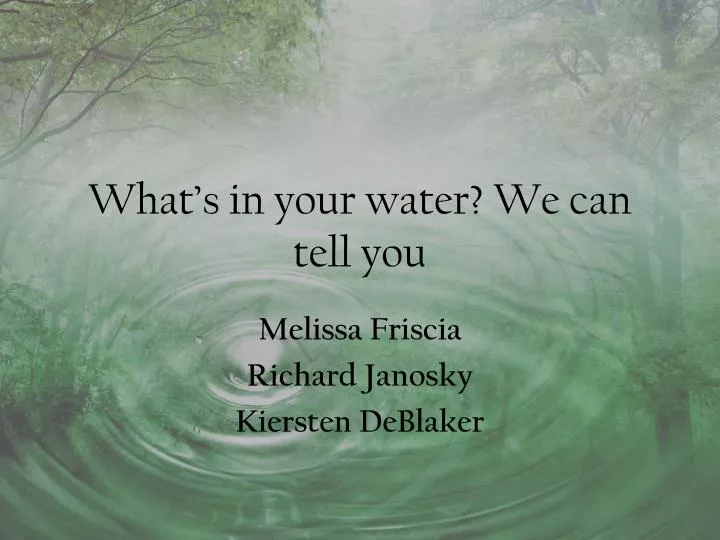
What’s in your water? We can tell you. Melissa Friscia Richard Janosky Kiersten DeBlaker. We care, you should too. http://www.youtube.com/watch?v=IJ3Khxf_I4c. Water samples. Before starting this experiment, we had to collect water samples of the stream running through the campus

E N D
What’s in your water? We can tell you Melissa Friscia Richard Janosky Kiersten DeBlaker
We care, you should too. http://www.youtube.com/watch?v=IJ3Khxf_I4c
Water samples • Before starting this experiment, we had to collect water samples of the stream running through the campus • WEATHER CONDITIONS: Cold, rainy and possibly freezing rain. • Collected samples on 04/01/2011
Water samples Tom’s Gas Station Rugby Field Walkway Had ducks, and multiple trash objects (soda cans, Beer bottles/cans).Discoloration: More civilization No trash visible and no animals.Rocky area
Water samples Footbridge Driving Bridge Smelled like a dirty fish tank. Food wrapper, orange peel Somewhat civilized with students No visible trash. Gate was closed sono cars recently gone through.Somewhat rocky area
Water samples MURPH’S!!! Well Water and Rain Well water was collected in a civilized area Rain was collected in a bottle Ducks, trash, iron bar, graffiti. Morecivilization (Apt, houses)
Calibration curves • Our calibration curves for all eight of our standards showed that our standards were made to the best of our abilities. • We were able to use our standards as a good prediction as to how our samples would turn out.
What this means…. Chromium Nickel Levels in natural water sources should be less then 10 ppb Levels in drinking water should be approximately 2 ppb RICHARD IS NOT DEAD • Levels in water is supposed to be around 0.06 ppb • We obtained a calculated concentration of around 4 ppm • RICHARD DOESN’T HAVE CANCER
IC Data Ion Chromatography Data
What this Means Nitrite Fluoride Rain water : fluoride is naturally found in rain water Heath risks: excess amount of fluoride Treatment: Natural water samples are not treated with fluoride like in a water treatment plant Civilization: more activity around the water decreased the amount of fluoride • How we think it got there: fertilizers and municipal sludge • High levels in water can cause harm to infants and livestock if allowed to drink the water • Ducks found in both places with the highest levels of nitrite in the water
What We Would Do Different NEXT TIME!! • Collect samples before and after the rain storm • Create standards in a smaller concentration • Test samples in the other surrounding natural waters here in York, PA
Conclusions • The ICP data was very skewed and did not give us accurate results; time restraints prevented us from re-running our samples • The IC produced accurate levels of ions in the samples • Would not advise drinking or playing in the stream running through York College
References • http://www.ext.colostate.edu/pubs/crops/00517.html • http://planetsave.com/2010/12/21/high-carcinogenic-chromium-levels-found-in-many-cities-tap-water/ • http://www.eco-usa.net/toxics/chemicals/nickel.shtml • http://www.fluoridealert.org/fluoridation.htm