Download
1 / 32
350 likes | 597 Views
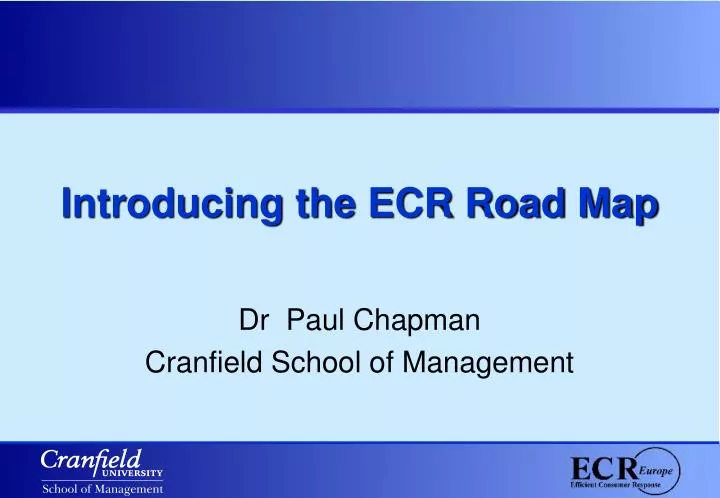
Introducing the ECR Road Map. Dr Paul Chapman Cranfield School of Management. 1. Plan. 2. Map & Measure. 6. Evaluate. 3. Analyse. 5. Implement. 4. Develop Solutions. The ECR Road Map. Call to Action. Source: Beck, A., Bilby, C.A.L., Chapman, P.A. and Harrison, A., (2001)

E N D
Introducing the ECR Road Map Dr Paul Chapman Cranfield School of Management
1. Plan 2. Map & Measure 6. Evaluate 3. Analyse 5. Implement 4. Develop Solutions The ECR Road Map Call to Action Source: Beck, A., Bilby, C.A.L., Chapman, P.A. and Harrison, A., (2001) Shrinkage: Introducing a Collaborative Approach to Reducing Stock Loss in the Supply Chain, ECR Europe: Brussels.
1. Plan 2. Map & Measure 6. Evaluate 3. Analyse 5. Implement 4. Develop Solutions The ECR Road Map Call to Action
The ECR Road Map Call to Action 1. Plan 2. Map & Measure 6. Evaluate 3. Analyse 5. Implement 4. Develop Solutions Source: Beck, A., Bilby, C.A.L., Chapman, P.A. and Harrison, A., (2001) Shrinkage: Introducing a Collaborative Approach to Reducing Stock Loss in the Supply Chain, ECR Europe: Brussels.
Concentrate on ‘Hot Products’ 100% 20% of SKUs account for 50% of loss 90% Cumulative Losses 8% of SKUs account for 30% of loss Number of SKUs
Project Charter – 1 Pager • Which Products? • Process Scope (from where to where?) • Performance measures and improvement target • Shrinkage - ?? % • Sales + ??% • Time Table • Start date • First results • Project completion
Project Charter – 1 Pager • Which Products? • Hot Products • Process Scope (from where to where?) • Store operations in hot stores • Performance measures and improvement target • Shrinkage - 50 % • Sales + 20% • Time Table • Start date now! • First results next week • Project completion 3 months
Board of Directors (Shareholders) Regulatory/ Government Bodies Project Colleagues Suppliers Logistics Service Providers Customers Consumers Identify Stakeholders
The ECR Road Map Call to Action 1. Plan 2. Map & Measure 6. Evaluate 3. Analyse 5. Implement 4. Develop Solutions Source: Beck, A., Bilby, C.A.L., Chapman, P.A. and Harrison, A., (2001) Shrinkage: Introducing a Collaborative Approach to Reducing Stock Loss in the Supply Chain, ECR Europe: Brussels.
Supply Chain Overview Gillette Pack Centre, UK Gillette DC, Hungary Tesco DC, Hungary Tesco store, Hungary Distribution Node Store
Supply chain process hierarchy Supply Chain Site Process Steps Supplier DC Receive products Retailer DC Put away in warehouse Pick order then marshal pallets Retailer Store Break seal in yard Load pallets into lorry Back lorry on to dock Unload pallets on to dock Dispatch to Carrefour Dist. Ctr Check pallet references Check number of pallets Attach pallet label Move pallet to warehouse location
Map Process Detail Lorry Arrives Check Paperwork & Seal Unload Delivery Sign for delivery Close & Seal Lorry
2 2 2 1 3 3 1 1 Measure Basic Inputs and Outputs of Every Site Supplier DC Retailer DC Retailer Store
The ECR Road Map Call to Action 1. Plan 2. Map & Measure 6. Evaluate 3. Analyse 5. Implement 4. Develop Solutions Source: Beck, A., Bilby, C.A.L., Chapman, P.A. and Harrison, A., (2001) Shrinkage: Introducing a Collaborative Approach to Reducing Stock Loss in the Supply Chain, ECR Europe: Brussels.
FMEA: Risk Assessment • Step 1. Identify the failure modes in each step of the process • In your group brainstorm for 1 minute per step • Capture every idea on a separate PostIt Note • Step 2. Score each failure mode • Use the S / O / D scoring scale S = severity O = likelihood of occurrence D = likelihood of detection • Step 3. Brainstorm the causes of the highest scoring risk • Use the fishbone diagram
Severity Measures Effect Occurrence Measures Failure & Effect Detection Measures Failure FMEA Example
Fishbone Diagram • Visual way to represent the relationship between a failure mode and possible causes • Every failure mode will have several causes
Fishbone Diagram – 1 pager People Materials Failure mode Machines Methods
Fishbone Diagram Example People Materials Don’t care, not important Unclear instructions Forgot Late delivery to store Key holder on holiday Door not locked Lock broken Other jobs took priority Lost key Machines Methods
Analysis Summary 1. FMEA 2. Fishbone Door not locked
The ECR Road Map Call to Action 1. Plan 2. Map & Measure 6. Evaluate 3. Analyse 5. Implement 4. Develop Solutions Source: Beck, A., Bilby, C.A.L., Chapman, P.A. and Harrison, A., (2001) Shrinkage: Introducing a Collaborative Approach to Reducing Stock Loss in the Supply Chain, ECR Europe: Brussels.
Action Planning Change Project Major Initiative Quick Win
The ECR Road Map Call to Action 1. Plan 2. Map & Measure 6. Evaluate 3. Analyse 5. Implement 4. Develop Solutions Source: Beck, A., Bilby, C.A.L., Chapman, P.A. and Harrison, A., (2001) Shrinkage: Introducing a Collaborative Approach to Reducing Stock Loss in the Supply Chain, ECR Europe: Brussels.
List the attributes of projects you have worked on Highlight the key differences between poor projects & good ones Been There, Done That?
ECR Road Map Principles • Collaborate and engage all stakeholders • Focus effort on the processes: Products / Information / Money • Identify greatest oppportunities then target root causes • Remove the opportunity for loss or error • Evaluate & learn
ECR Road Map Benefits • Ensures the right resources and people engaged • Better and more sustainable results • Less daunting • More cost efficient • Higher probability of success • Quicker to implement • Lessons can be reapplied to other problems