Download
1 / 28
280 likes | 394 Views
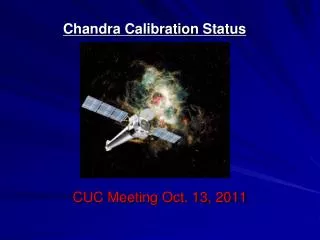
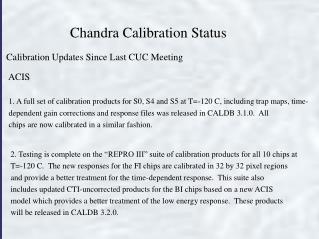
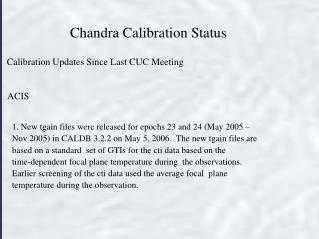
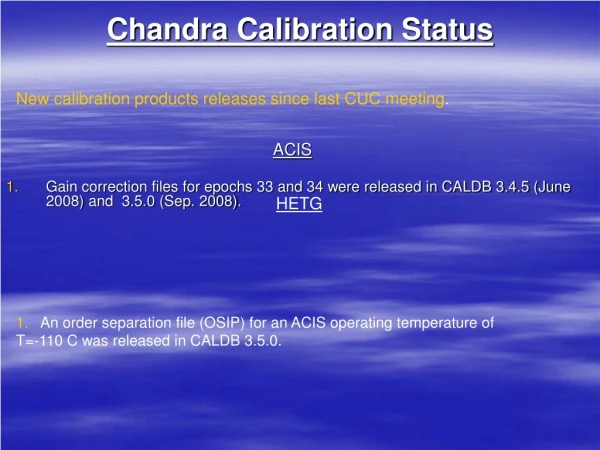
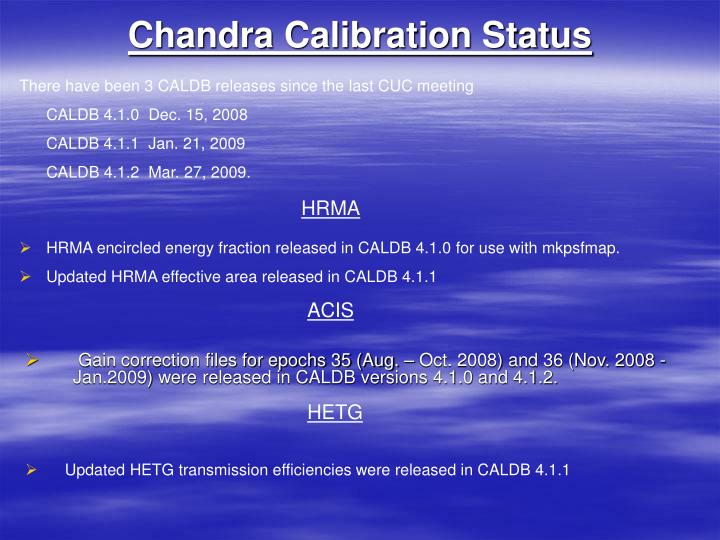
There have been 3 CALDB releases since the last CUC meeting CALDB 4.1.0 Dec. 15, 2008 CALDB 4.1.1 Jan. 21, 2009 CALDB 4.1.2 Mar. 27, 2009. Chandra Calibration Status. HRMA. HRMA encircled energy fraction released in CALDB 4.1.0 for use with mkpsfmap.

E N D
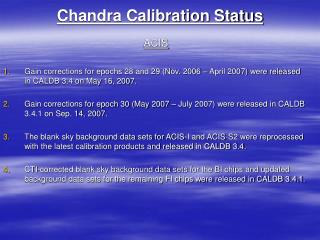
There have been 3 CALDB releases since the last CUC meeting CALDB 4.1.0 Dec. 15, 2008 CALDB 4.1.1 Jan. 21, 2009 CALDB 4.1.2 Mar. 27, 2009. Chandra Calibration Status HRMA • HRMA encircled energy fraction released in CALDB 4.1.0 for use with mkpsfmap. • Updated HRMA effective area released in CALDB 4.1.1 ACIS Gain correction files for epochs 35 (Aug. – Oct. 2008) and 36 (Nov. 2008 -Jan.2009) were released in CALDB versions 4.1.0 and 4.1.2. HETG • Updated HETG transmission efficiencies were released in CALDB 4.1.1
Updated HRMA Effective Area Empirical XRCF correction Two corrections were applied to the predictions of the raytrace code before CALDB 4.1.1 HRMA overlayer of 22A
Re-Analysis of the Ground-Based (XRCF) Data SSD Continuum Measurement HETG Continuum Measurement
Current HRMA Calibration • Do the mirror shutters block a greater fraction of the beam than presently predicted by the raytrace code – Analysis of HSI ring focus images show that the shutters reduce the throughput of the mirrors by at most 1%. • Is a greater fraction of the beam scattered beyond the 2mm pinholes used for effective area than presently predicted by the raytrace code – The measured 2mm/35mm flux ratio is consistent with the predictions of the raytrace code below 2 keV and is approximately 3% less than the value predicted by the raytrace code at 6 keV. • Improve the pile-up correction for the SSD continuum measurements. • Investigate the discrepancy between FPC and SSD measurements.
Measured FPC 2mm/35mm flux ratio vs. energy • Improve the pile-up correction for the SSD continuum measurements. • Investigate the discrepancy between FPC and SSD measurements.
ACIS Calibration Status Update on the ACIS Contamination Model
Spectrum of ECS L-Complex F-K edge
ECS data fit with the old and new spectral model for the L-complex Old Spectral Model New Spectral Model Old Spectral Model
Revised HETG Efficiencies CALDB 4.1.1
HRC-S QE Re-Calibration Power law Fits to contemporaneous HETG and LETG observations of PK2155-304 HEG MEG LEG • Complicated by: • Spectral shape/intensity variability • Parameter non-orthogonality • Possible PL curvature • HRC-S 0.5-10keV QE calibrated and fine-tuned in-flight using LETG blazar continua • HRMA EA revision requires QE re-calibration • Account for: • HRMA EA changes • Accumulated in-flight data suggesting overly-hard power-law indices than HETG+ACIS by of order 5% • Will require relative QE correction between ~0.5-5keV of ~15%
CUC Calibration Wish List 1) Astrometric CalibrationDo observers have ready access to any study of the astrometriccalibration of the mission PSF tools, e.g. if a field of sourceswith well-known positions is both observed and simulated by thePSF tools, how well do the observed and simulated data sets line up? Astrometry - The overall 90% uncertainty in absolute positions is 0.6”. This is given on the CXC web pages and in the POG. The mean off-set between CSC and SDSS positions is 0.2” On-axis PSF - There are several on-line Chandra calibration workshop presentations as well as a discussion in the POG on this topic. The CSC Catalog Statistical Characterization memo shows that the uncertainties in relative astrometry for bright point sources is 0.2” within off-axis angles of 10’ and approximately 1” at larger off-axis angles. A study has begun to simulate a Chandra observation of the open star cluster NGC2516 with SAOTrace and then compare the x-ray source positions as determined by wavdetect with the optical positions.
2) ACIS Bad Pixel TableData discarded via entries in the ACIS Bad Pixel Table (obviously)reduces the effective area of the mission. Currently, the standardBad Pixel Table aggressively removes ACIS columns and is not necessarilyappropriate for all kinds of ACIS science. Modifications to the ACISBad Pixel Table should pass through an approval process which includesconsultation with the Users Committee. Several different ACIS Bad PixelTables, each optimized Data systems is revising the CIAO tool acis_build_pixel so the user has much more freedom in specifying the bad pixels.
3) RMFs and ARFsUsers need the capability of creating RMFs and ARFs for user-selectedgrades. There are several benefits: - for bright piled-up sources filtering on only single events will in general reduce pileup - for faint non-piled-up sources a non-standard grade selection can increase effective area - for bright non-piled-up sources a non-standard grade selection may improve energy resolution. Since the Chandra beam is comparable to the size of an ACIS pixel, grade 0 events are not necessarily un piled-up. The standard grade set is 02346. In general, grades 1 and 5 add about 1-2% to the standard grade set. For soft sources, grade 7 is heavily dominated by charged particles. For photon energies greater than 6 keV, grade 7 events can add an additional 10% to the standard grade set, however the background rate is 75 times higher when including grade 7 events.
ACIS Flight Grades Grade 0 – single pixel Grade 1 – Diagonal split Grade 2 – vertical split Grades 3 and 4 - horizontal splits Grade 5 – L-shaped + corner Grade 6 – L shaped Grade 7 – everything else
E0102-72 . ACIS-I3 ACIS-S3 Grade 02346 1 Grade 02346 1 5 7 5 7
G21.5-09 . ACIS-S3
E0102-72 . ACIS-S3 ACIS-I3
Cas A . ACIS-S3 ACIS-I3
4) ACIS Contamination Model 5) Soft Proton ContaminationProper statistical treatment of backgrounds requires a model of thebackground spectrum, but what is this for the soft proton contamination?In addition, what is the spatial distribution of the soft protoncontamination? Is it uniform, or is it vignetted at all by the HRMA? The most common type of BI flare is very well-behaved, has a reproducible spectrum (a power law with an exponential cutoff (see Markevitch et al. 2003, ApJ 583, 70), and a spatial distribution that is non-uniform but energy-independent. These results were presented at the 2003 Chandra Calibration meeting (http://cxc.harvard.edu/ccr/proceedings/03_proc/presentations/markevitch2/s005.html) This information can be added to the CIAO thread for generating background images for extended sources. We can also provide a tool which will add in the background flare component in a blank sky image.