Download
1 / 13
130 likes | 237 Views
AP Review. Exploring Data. Describing a Distribution. Discuss center, shape, and spread in context. Center: Mean or Median Shape: Roughly Symmetrical, Right or Left Skewed Spread: Standard Deviation, IQR, Range, or Spread. Checking for Outliers.

E N D
AP Review Exploring Data
Describing a Distribution Discuss center, shape, and spread in context. Center: Mean or Median Shape: Roughly Symmetrical, Right or Left Skewed Spread: Standard Deviation, IQR, Range, or Spread
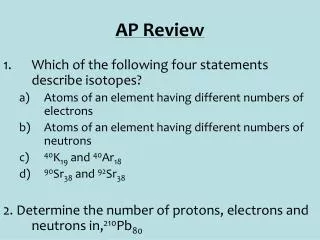
Checking for Outliers A survey was conducted to gather ratings of the quality of service at local restaurants at a nearby mall. Respondents were to rate overall service using values between 0 (terrible) and 100 (excellent). The five number summary is 32, 47.5, 51, 63.5, 92. The data values above Q3 are 65, 66, 70, 71, and 92. Are there outliers on the high end?
Checking for Outliers Outliers > Q3 + 1.5(IQR) Outliers > 63.5 + 1.5 (63.5 – 47.5) Outliers > 87.5 Therefore, 92 is an outlier.
Robust and Sensitive Statistics • Robust (not affected by extreme values) Median, IQR • Sensitive (affected by extreme values) Mean, s, range
Parameters and Statistics • Parameters are numerical values that describe a population. • Statistics are numerical values that describe a sample.
Z – Scores and Percentiles • Barron’s p. 41 #10 • Assuming that batting averages have a bell-shaped distribution, arrange in ascending order: I. An average with a z-score of –1 II. An average with a percentile rank of 20%. III. An average at the first quartile, Q1. I, II, III
Normal Distribution • Barron’s P. 367 #3 • The average yearly snowfall in a city is 55 inches. What is the standard deviation if 15% of the years have snowfalls above 60 inches? Assume yearly snowfalls are normally distributed.
Linear Regression • Don’t forget about formulas on chart. • r is the correlation coefficient. • r^2 is the coefficient of determination. • r has no units • Strong r indicates association, not causation. • r is not affected if x & y are reversed or if operations (mult, divide, add, sub) are performed on each x or on each y.
Linear Regression • r^2 describes the percent variation of the dependent variable, y, explained by the linear relationship (LSRL) with the independent variable, x. PUT IN CONTEXT! • When discussing r, describe line as weak, moderate, or strong linear relationship between x & y
Linear Regression • Influential Point – pulls regression line toward it. An influential point is usually a point in the x-direction. • Outlier – shows up in residual plot usually in the y – direction.
Linear Regression • When performing Linear Regression, do the following: Create a scatterplot Calculate the equation of the regression line Plot the residuals A residual is the observed y – predicted y.
Barron’s Problems • Multiple Choice P. 370 #13, 14, 16, 19, 21, 24, 27, 30, 38 • Free Response P. 430 #2