Download
1 / 2
20 likes | 167 Views
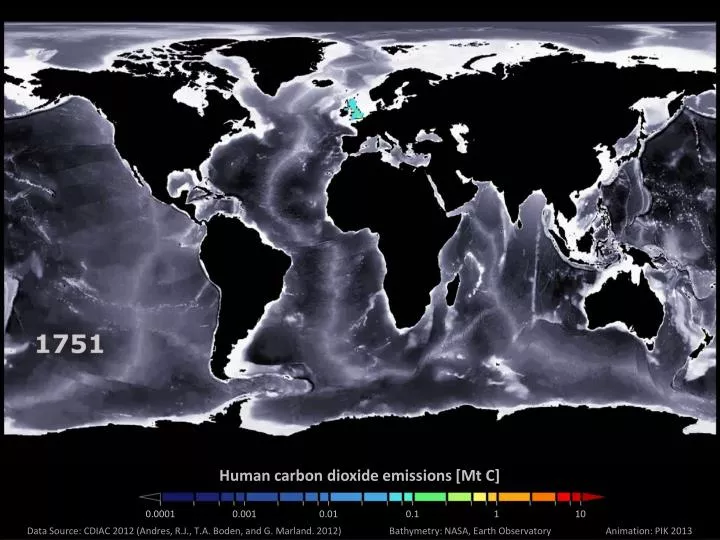
Human carbon dioxide emissions [ Mt C]. 0.0001. 0.001. 0.01. 0.1. 1. 10. Data Source: CDIAC 2012 (Andres, R.J ., T.A. Boden, and G. Marland . 2012). Bathymetry : NASA, Earth Observatory. Animation: PIK 2013. Cumulative human carbon dioxide emissions [ Mt C]. 0.001. 0.01.

E N D
Human carbondioxideemissions [Mt C] 0.0001 0.001 0.01 0.1 1 10 Data Source: CDIAC 2012 (Andres, R.J., T.A. Boden, and G. Marland. 2012) Bathymetry: NASA, Earth Observatory Animation: PIK 2013
Cumulative human carbondioxideemissions [Mt C] 0.001 0.01 0.1 1 10 100 1000 Data Source: CDIAC 2012 (Andres, R.J., T.A. Boden, and G. Marland. 2012) Bathymetry: NASA, Earth Observatory Animation: PIK 2013