Download
1 / 3
30 likes | 139 Views
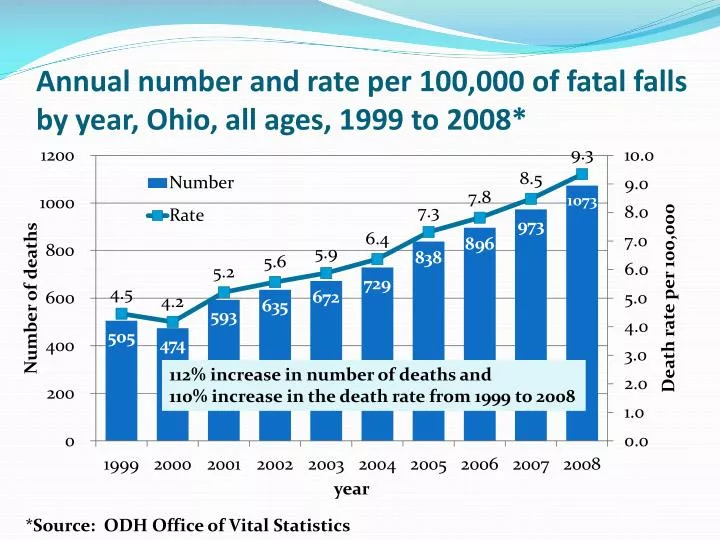
Annual number and rate per 100,000 of fatal falls by year, Ohio, all ages, 1999 to 2008*. 112% increase in number of deaths and 110% increase in the death rate from 1999 to 2008. *Source: ODH Office of Vital Statistics.

E N D
Annual number and rate per 100,000 of fatal falls by year, Ohio, all ages, 1999 to 2008* 112% increase in number of deaths and 110% increase in the death rate from 1999 to 2008 *Source: ODH Office of Vital Statistics
Annual number and rate per 100,000 of fatal falls by year, ages 65+, Ohio2000 to 2008* 140% increase in number of deaths and 129% increase in the death rate from 2000 to 2008 *Source: ODH Office of Vital Statistics
Fall death rate per 100,000, ages 65+, by year, sex, Ohio, 2000-08* 144% increase in death rate for males from 2000-08 121% increase in the death rate for females 2000-08 *Source: ODH Office of Vital Statistics (all intents)