Download
1 / 31
310 likes | 449 Views
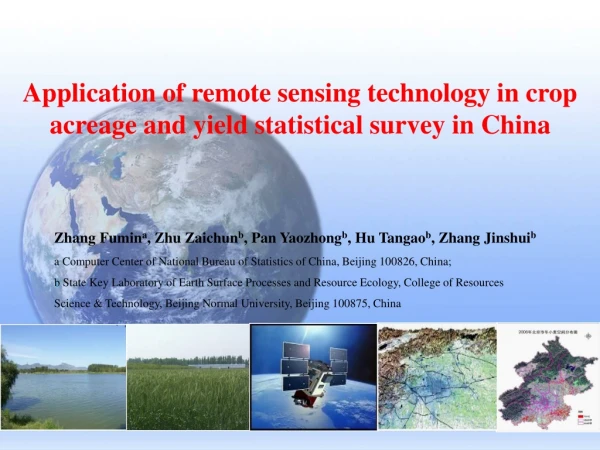
Application of remote sensing technology in crop acreage and yield statistical survey in China. Zhang Fumin a , Zhu Zaichun b , Pan Yaozhong b , Hu Tangao b , Zhang Jinshui b a Computer Center of National Bureau of Statistics of China, Beijing 100826, China;

E N D
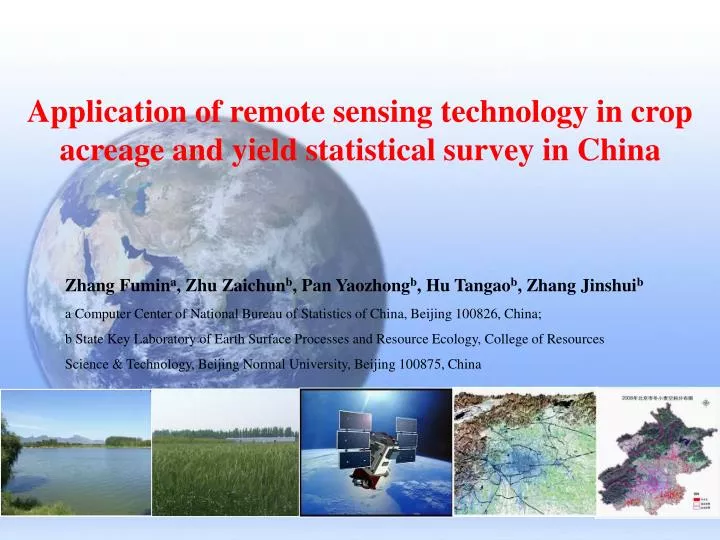
Application of remote sensing technology in crop acreage and yield statistical survey in China Zhang Fumina, Zhu Zaichunb, Pan Yaozhongb, Hu Tangaob, Zhang Jinshuib a Computer Center of National Bureau of Statistics of China, Beijing 100826, China; b State Key Laboratory of Earth Surface Processes and Resource Ecology, College of Resources Science & Technology, Beijing Normal University, Beijing 100875, China
1. Development process of crop area and yield estimation survey system in China 2. Development of crop area and yield estimation by remote sensing measurements 3. Application status of agriculture survey by remote sensing in China 4. Summary and outlook Contents
1. Development process of crop area and yield estimation survey system in China
Development process of the existing survey system in China can be divided into five phases: (1) The initial stage in 50s, 20th century; (2) The stage of development in 60s, 20th century; (3) The early recovery period in 80s, 20th century; (4) The full implementation phase after 1984; (5) Sample rotation and multi-subject survey after 2000. 1.1 Historical origin
The current survey system has following shortages: foundation of sample survey is not solid enough; sample survey objects are unstable; sampling methods are backward; the quality of investigation is lack of control. 1.2 Development needs
we need to further improve the crop sampling system from the following aspects: Improve the survey system: from the traditional catalog sample to space sample, and expand the connotation of the investigation targets, provide not only crop area and yield in digital form, but also with crop spatial distribution information and survey result that can be used for provincial, county and village Improve the survey results: reducing the impact of subjective factors, improve the objectivity of the results, enhance the timeliness of reports, and dynamically monitor the crops in the critical period of growing season; Improve means of investigation: use the "3S" techniques to replace the existing tools such as ground measuring using the tape. 1.2 Development needs
2. Development of crop area and yield estimation by remote sensing measurements
2.2 Development progress of major research projects and technical system in China
3. National Statistics and Remote Sensing System of Crop Production(NSRCP)
3.1 Framework of NSRCP Framework of NSRCP
Survey crops : wheat, corn and rice. Survey contents: Acreage and Yield. Accuracy : better than 95% under the confidence level of 95% at the county-level. Report frequency : Acreage should be annually report, and the yield should be report three times: preliminary report, pre-production and actual production. 3.2 Survey System of NSRCP
3.3 Key technology system of NSRCP • There are four key technology system of NSRCP: • Geo-spatial framework • Ground-support network • Planting area measurement • Growth monitoring and yield estimation
3.3.1 Geo-spatial framework Geo-spatial framework is the basis of NSRCP. Geo-spatial framework mainly includes: 1 Theoretical framework construction 2 Database system design 3 Application demonstration of space-based statistics and remote sensing and so on.
3.3.1 Geo-spatial framework Geo-spatial framework of NSRCP
3.3.2 Ground-support network Ground-support network achieve associated ground survey information of planting area and production of main crops timely and accurately. The main survey content includes: sampling plot survey, high resolution area survey, typical area survey, county-level bio-meteorology survey and cropping structure of sampling village survey.
3.3.2 Ground-support network Ground survey organization chart
3.3.3 Planting area measurement In support of mass to-ground sampling data by National Bureau of Statistics, crop acreage measurement methodology mainly includes: 1 Regionalization of crop acreage measurement 2 Measurement techniques at regional/county level (remote sensing) 3 Measurement techniques and methods at the county level (remote sensing and sampling) 4 Measurement techniques and methods at the provincial level (remote sensing and sampling) 5 Analysis and evaluation methods
3.3.3 Planting area measurement Planting area measurement system of NSRCP
3.3.4 Growth monitoring and yield estimation The program mainly includes: 1 Regionalization of crop yield estimation 2 Growth monitoring techniques 3 Techniques of crop yield estimation using weather information 4 Techniques of crop yield estimation based on historical statistical data at county-level and remote sensing technology 5 Techniques of crop yield estimation based on real measured yield data and remote sensing technology 6 Techniques of crop yield estimation based on crop growth model and remote sensing technology
3.3.4 Growth monitoring and yield estimation Figure 5 Crops growth monitoring and yield estimation technology system of NSRCP
3.4 Applications of NSRCP Since the establishment of NSRCP, Beijing Normal University, Chinese Academy of Agricultural Sciences and local coordination institutions, supported by the National Bureau of Statistics, have tested run the system in Jilin, Henan, Jiangsu, Hubei and Beijing, and gradually extended to 13 major grain-producing provinces in China. Here is an example in Jiangsu province.
3.4.1 Winter wheat acreage measurement in Jiangsu province in 2009 Date : From May 21 until June 20, the National Bureau of Statistics, Beijing Normal University and other research institutes took about 30 days to complete the winter wheat acreage measurement in Jiangsu province in 2009. Data : present HJ and ALOS, history SPOT as base map, high precision block maps, administrative division maps, traffic information, phenological calendar, planting structure and meteorological data. Result : With multi-level multi-scale sampling and field survey, winter wheat planted area in Jiangsu province in 2009 is 3225.0 mu, which is calculated out by sampling back stepping.
3.4.1 Winter wheat acreage measurement in Jiangsu province in 2009 Multi-level multi-scale sampling plots at province level
County Results Town Results(Reference) • 3.4.1 Winter wheat acreage measurement in Jiangsu province in 2009 Spatial distribution of the winter wheat in Jiangsu province in 2009
3.4.2 Winter wheat yield measurement in Jiangsu province in 2009 Date : From May 15 until June 31, the National Bureau of Statistics and Beijing Normal University took 15 days to complete the winter wheat yield measurement in Jiangsu province in 2009. Data : MODIS in the growing season of winter wheat, present HJ and ALOS, regionalization map of yield estimation, administrative division maps, real measured yield data, historical statistical data at county-level and meteorological data. Result : We predict that yield of winter wheat in Jiangsu province in 2009 is 5334.12 kg / ha, which is a little lower than in 2008, decrease degree is about 0.79%.
3.4.2 Winter wheat yield measurement in Jiangsu province in 2009 Yield of winter wheat in Jiangsu in 2009
4.1 Summary • Problems for international major research programs: • Main Research methods are sampling combined with remote sensing to obtain large-scale crop acreage and yield, which cannot provide results for all levels of government departments to meet the requirement of national statistical offices. • there are many problems in these systems, such as indicator, statistical unit classification, survey system, survey accuracy and so on. It is difficult for these systems to enter the national survey system. • NSRCP solve these problems to a certain extent: • 1.Expand current survey indicators comprehensively, provide relatively accurate and objective results, and gradually meet the growing demands of national statistics and the public, under the promise that the timeliness of statistical survey is ensured. • 2.The system combine the advantages of the country's current survey system and "3S" technology comprehensively. Since its inception, NSRCP has been tested run in demonstration provinces such as Jilin, Henan, Jiangsu, Hunan and Beijing.
4.2 Outlook Through testing run in these provinces, we found that the system still needs major breakthrough at the following two points: (1) Improve the ground-support network: Set up a wireless sensor network in crop measurement area to monitor crop conditions at real time, provide accurate real-time parameters for crop acreage and yield measurement models, which can reduce the cost of field investigation and exclude the interference of man-made factors. (2) Increase the accuracy of crop acreage and yield estimation: Improve remote sensing measurement methods by using multi-source multi-scale remote sensing data and real-time crop growth information provided by wireless sensor network. Improve measurement accuracy of sampling plots to improve the reliability of the result of multi administrative level.