Download
1 / 17
170 likes | 299 Views
RF measurement of T18 after High power test. Jiaru Shi 27.07.2011. CERN built T18. Before high power testing. after high power testing. Faya Wang @ SLAC. Faya Wang @ SLAC. Before high power testing. After high power testing. Standing wave pattern Reflection before last regular cell.

E N D
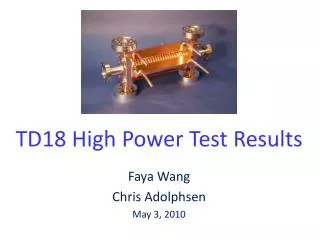
RF measurement of T18 after High power test Jiaru Shi 27.07.2011
CERN built T18 Before high power testing after high power testing
Before high power testing After high power testing
Detuning of cells(difference of required tuning) Not sure for input matching cell
Amplitude Measurement of T18-SLAC #1 Before and After High Power Test Juwen Wang @ SLAC 11421.7 MHz at 21.32°C, N2 Before high Power test 1350 hours 11421.87 MHz at 20.4°C, N2 After high power test
Phase Measurement of T18-SLAC #1 Before and After High Power Test Juwen Wang @ SLAC 11421.87 MHz at 20.4°C, N2 After high power test 11421.7 MHz at 21.32°C, N2 ore high Power test
Amplitude Measurement of TD18-SLAC Before and After High Power Test Juwen Wang @ SLAC 11424.5 MHz at 21.46°C, N2 Before high Power test 11424.56 MHz at 21.1°C, N2 After high power test
Phase Measurement of TD18-SLAC Before and After High Power Test Juwen Wang @ SLAC 11424.56 MHz at 21.1°C, N2 After high power test 11424.5 MHz at 21.46°C, N2 ore high Power test 16.5° Select bead pulling frequencies based on the same measurement condition for both before and after high power test
Amplitude Measurement of T18-SLAC #1 Before and After High Power Test Juwen Wang @ SLAC T24 11424.1 MHz at 20.02°C, N2 Before high Power test 11424.15 MHz at 20.4°C, N2 After high power test
Phase Measurement of T24-SLAC Before and After 800 Hours High Power Test Juwen Wang @ SLAC 11424.1 MHz at 21.2°C, N2 Before high power test 11424.1 MHz at 21.1°C, N2 After high Power test 6º Select bead pulling frequencies based on the measurement condition to get 2π/3 phase advance for both before and after high power test
TD18 Chamfer100 um -1MHz Chamfer TD18
TD18 Iris ellipse aspect ratio 1.1to 1.2frequency + 8.2MHz aspect ratio +1MHz ~ removing 0.12mm3 copper at the iris