Download
1 / 1
10 likes | 104 Views
Supplemental Fig. 1 Kaplan-Meier curves demonstrating rates of the combined endpoint death/MI over a median follow-up period of 271 days when elevations of either cTnI or hs-cTnT were present. 100. 100. 95. 95. hs-cTnT<99th. 90. 90. cTnI<99th. 85. 85. 80. 80. hs-cTnT ≥ 99th.

E N D
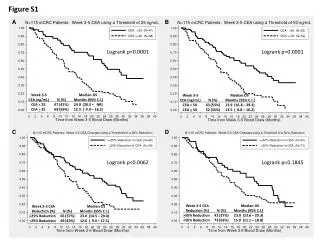
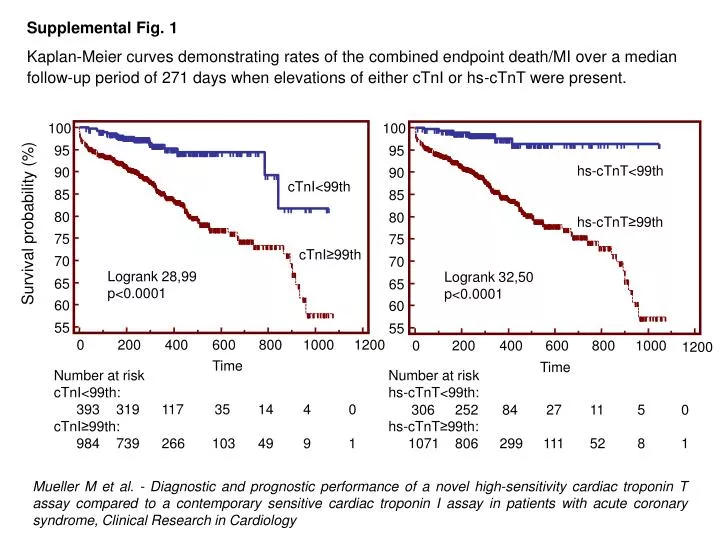
Supplemental Fig. 1 Kaplan-Meier curves demonstrating rates of the combined endpoint death/MI over a median follow-up period of 271 days when elevations of either cTnI or hs-cTnT were present. 100 100 95 95 hs-cTnT<99th 90 90 cTnI<99th 85 85 80 80 hs-cTnT≥99th Survival probability (%) 75 75 cTnI≥99th 70 70 Logrank 28,99 p<0.0001 Logrank 32,50 p<0.0001 65 65 60 60 55 55 0 200 400 600 800 1000 1200 0 200 400 600 800 1000 1200 Time Time Number at risk Number at risk cTnI<99th: hs-cTnT<99th: 393 319 117 35 14 4 0 306 252 84 27 11 5 0 cTnI≥99th: hs-cTnT≥99th: 984 739 266 103 49 9 1 1071 806 299 111 52 8 1 Mueller M et al. - Diagnostic and prognostic performance of a novel high-sensitivity cardiac troponin T assay compared to a contemporary sensitive cardiac troponin I assay in patients with acute coronary syndrome, Clinical Research in Cardiology