Download
1 / 24
240 likes | 248 Views
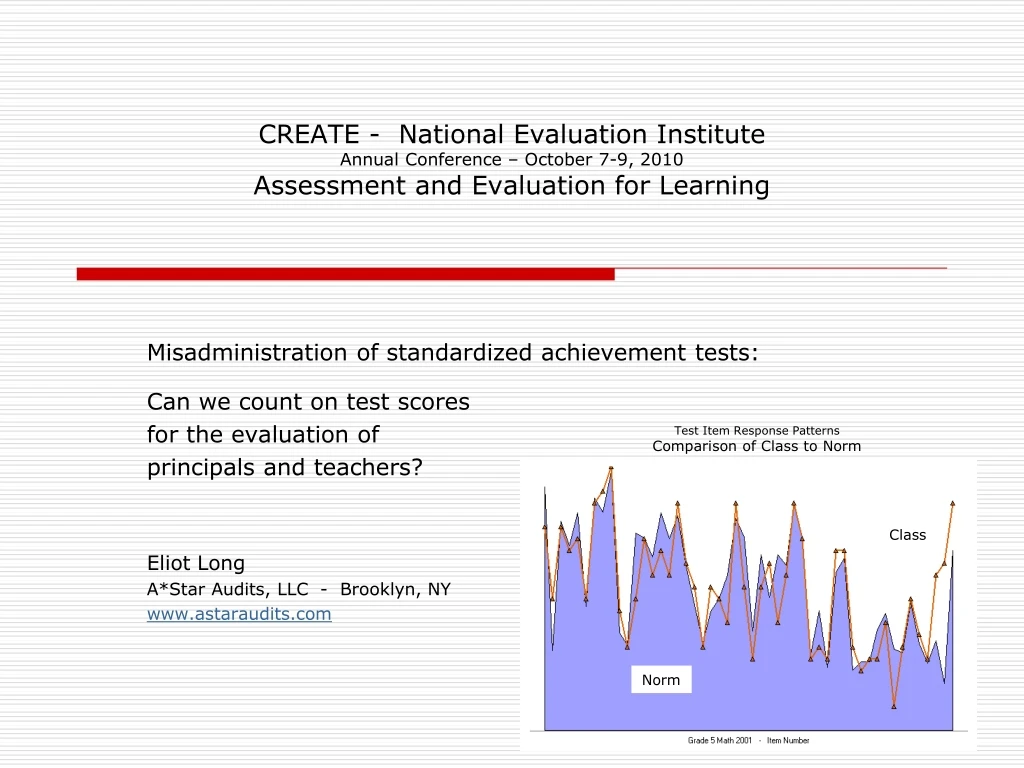
CREATE - National Evaluation Institute Annual Conference – October 7-9, 2010 Assessment and Evaluation for Learning. Misadministration of standardized achievement tests: Can we count on test scores for the evaluation of principals and teachers? Eliot Long

E N D
CREATE - National Evaluation InstituteAnnual Conference – October 7-9, 2010Assessment and Evaluation for Learning Misadministration of standardized achievement tests: Can we count on test scores for the evaluation of principals and teachers? Eliot Long A*Star Audits, LLC - Brooklyn, NY www.astaraudits.com Test Item Response Patterns Comparison of Class to Norm Class Norm
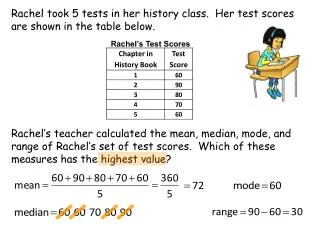
Finding Meaning In the Difference Between Two Test Scores Schools experience erratic, inexplicable variations in measures of achievement gains. “This volatility results in some schools being recognized as outstanding and other schools identified as in need of improvement simply as the result of random fluctuations. It also means that strategies of looking to schools that show large gains for clues of what other schools should do to improve student achievement will have little chance of identifying those practices that are most effective.” Robert L. Linn and Carolyn Haug (Spring 2002) Stability of school-building accountability scores and gains. Educational Evaluation and Policy Analysis, 24(1), 29-36. What is the contribution of test administration practices?
Misadministration of TestsA broad range of behaviors with cheating at one end Standardized test administration procedures - Follow an approved script of test directions - Follow approved procedures for use of materials and timing - Provide no unauthorized assistance to students Misadministration of tests - Add directions for guessing (how to answer when you don’t know how to answer) - Rephrase directions and test questions - Provide hints and instruction on test content - Modify timing as deemed necessary - Suggest corrections for obvious errors - Provide answers to difficult questions - Fill in blanks / change answers following the test administration There is no ‘bright line’ for cheating, yet all forms of misadministration undermine test score reliability
Identifying / Evaluating Misadministration of Tests“How do we know it is misadministration – or cheating?” Methods of investigation - Interviews with teachers, students and school administrators - Erasure analysis - Retesting - Statistical analysis Confirmation for statistical analysis - Management Information Report, Jan. 2010 Dept. of Education, Office of Inspector General OIG data analytics project investigated 106 test administrators indicated by the A*Star method; 83 were identified by the OIG while a number of others were eliminated due to their small number of test administrations or the statute of limitations. See Report at: www2.ed.gov/about/offices/list/oig/alternativeproducts/x11j0002.pdf
The A*Star Method Evaluation is based on all student groups tested with the same test and same set of standardized test administration procedures. Steps: • Determine normative test item response patterns by group achievement level • Measure each student group (i.e. classroom, school) against the group’s achievement level norm • Identify those groups that significantly differ from the norm • Evaluate the nature of response pattern deviations • Identify test-takers and test items subject to improper influence
The A*Star MethodBased on group test item response patterns A*Star response pattern analysis: A simple plot of the percent correct (p-value) for each test question provides a highly stable response pattern. And describes the group success with each test item. Easier items More difficult items
Comparison to a Peer Group Norm Skill Level Norm: All classrooms at the same achievement level set a peer group or ‘skill level’ norm. P-value correlation: One method of comparison is a correlation of group and skill level p-values. Here, for a 50 item test, n = 50; r = .95 Percent attempted: The line with stars indicates the percent of students in the group who answer each item. Skill Level Norm
A Range of Norms for a Range of Achievement Test-taker groups (i.e. classrooms) at different levels of achievement are grouped to provide a number of different peer group (or skill level) norms. Norms confirm test reliability Norm patterns illustrate internal consistency Peer group norms improve the measurement of test-taker groups and the interpretation of the results. 8 of 27 skill level norms determined for a 2001, grade 5 math test are illustrated here.
Regular Response Patterns4 classroom patterns representing a range of achievement Test score reliability - and our experience – expect group response patterns to closely follow the norm at all skill levels. RS RS 23 26 RS RS 30 34
Irregular Response PatternsEncouraged guessing disrupts measurement When student responses are subject to a significant, improper influence, the group response pattern deviates from the norm in measureable ways. The class below has a poor n = 8 correlation with the norm (.74). RS = 29.4 Guessing by some students and r Corr. = .80 teacher actions to encourage it contradict norm patterns. Full class: n = 18; RS = 22.3; r Corr. = .74 n = 10 RS = 16.6 r Corr. = .44 25% Correct
Improper InfluenceSubject Group Analysis When test administrators provide a significant level of improper assistance, the response patterns become clearly irregular. A ‘Subject Group Analysis’ (SGA) may identify subsets of students and test Subject Group answers that are highly unlikely to occur n = 10; RS = 32.4 without assistance. r Corr. = .66 SGA P = 1.8E-08 Full Class - n = 22; RS = 27.2; r Corr. = .83 Remaining Group n = 12; RS = 22.9 r Corr. = .82
Improper Influence Comes in Many Forms & Levels Influence that is limited to the last test items may indicate a frustration built over the test session. Influence that begins with the early items and continues is more likely a purposeful effort to raise test scores. n = 18; RS = 33.4; r Corr. = .61 SGA: n = 9; P = 7.5E-014 n = 23; RS = 29.6; r Corr. = .73 SGA: n = 12; P = 3.7E-022 n = 27; RS = 32.0; r Corr. = .75 SGA: n = 21; P < E-045
Consistency of Test AdministrationGrade 5 Math 2001 - Urban School District Consistency in test administration When all test-taker groups are correlated with their appropriate skill level norms, the distribution of correlation coefficients indicates the consistency of the test administrations. Group correlations are expected to be high - .90 or better. Problems in test administration are likely below .85. Classrooms and Schools A comparison of classroom groups with school groups indicates a lower consistency in classroom test administrations. Classrooms median r = .900 Schools median r = .960
Classrooms & SchoolsIt is easier to identify misadministration in small groups Classrooms show more volatility as compared to schools because: - Classrooms are where the action is – by students and teachers - Classrooms are smaller – individual student behavior may make a greater difference - In school response patterns, problems in one classroom may be masked by good data from other classrooms. Conversely: - Improper influence by school administrators (passing out answers before the test session/changing answers afterward)will create improbable patterns involving large numbers of students, crossing over classrooms and creating highly unlikely patterns.
Comparing 2001 to 2008Based on school level response patterns School correlations with their respective skill level norms MC Items Correlation No. Percent with the Norm YearAssessment ProgramAssessmentSchoolsCorrectMed.1st Q. 2001 East coast urban school district grade 5 math 667 68.7% .96 .94 2008 East coast state, statewide grade 4 math 1,311 73.4% .90 .87 2008 Midwest state, statewide grade 5 math 1,702 59.2% .89 .85 Note: The east coast urban school district is not in the east coast state. School correlations with their appropriate response pattern norms are substantially lower in 2008 as compared with 2001. Low correlations may indicate confusion, excessive guessing and various test-taking strategies – and they may indicate purposeful efforts to raise test scores. Low correlations always means lower test score reliability.
School Level Response Patterns2008 Irregularities in Grade 5 Math Small school: n = 23; RS = 38.1; r Corr. = .42 Subject Group: n = 8; P = 3.3E-023 Small to medium size school: n = 47; RS = 31.8; r Corr. = .18 Compare MC to OE (Constructed response)
School Level Response Patterns2008 Irregularities at Grade 5 Math Medium Size School n = 69; RS = 30.9; r Corr. = .70 Subject Group: n = 30; P = 5.0E-021 Large Size School n = 253; RS = 26.7; r Corr. = .87 Subject Group: n = 68; P = 4.9E-019
Identifying & Measuring Misadministration What constitutes “significant” cases of misadministration (cheating)?” Number of test items effected Improper influence on any test item is wrong, but influence on only a few items is more likely an effort to facilitate the test administration rather than to materially raise test scores. Number of students involved My sense of it is that a large number of items for a few students is a greater problem than a few items for a large number of students – the latter may be a perceived problem with the items while the former an effort to raise the scores of lower performing students. Improbability of response pattern. Any probability less than 1 in 10,000 is significant, but common, wrong answers create unusually low probabilities that may overshadow more important problems. A “six sigma” approach is conservative. Definition used here: Minimum 10% of test items Minimum #SGA students times #SGA items = 5% of all responses Probability less than 1 in 100,000 (less than 10 in one million)
AnalysisRandom and Extended Samples Frequency of significant influence in the assessment setting SGA applied to random samples 2001 - Approximately 12% of all classrooms and 45% of all schools in the urban district. 2008 - Approximately 30% of all schools in statewide reviews. Frequency of significant influence by school size SGA applied to extended samples selected based on school size (a) Number of classrooms (2001) (b) Number of students tested (2001 & 2008) Frequency of school administration influence SGA applied to extended samples selected based on: (a) Response pattern characteristics suggestive of irregularities. (b) Selected school districts by location and size.
Table of ResultsFrequency of Significant Influence In 2001, approximately 3% of grade 5 classrooms and 2% of elementary schools in a large urban school district are identified as involving a significant misadministration of grade 5 math tests. In 2008, approximately 14% of elementary schools in one state and 34% of elementary schools in another state are identified as involving a significant misadministration of grade 4 and grade 5 math tests, respectively. A portion of the identified cases of misadministration may be the result of test-taking strategies, not generally regarded as cheating; all are most likely to involve the active efforts of teachers or school administrators outside of the standardized test administration procedures and necessarily result in a lost of test score reliability.
Small Schools - 2001 & 2008 School size The median correlation declines for small schools in the urban district and in both states, with the 1st quartile correlation dropping below .85 in the state samples. The frequency of significant misadministration rises among small schools for both the urban district and State #1, but declines for State #2. The low correlations in State #2 represent misadministration of the test, yet the form is likely to more often include confusion, excessive guessing, and misdirection as compared to larger schools in the same state Nevertheless, the frequency of significant misadministration remains exceptionally high.
Small Schools in 2001Significant Influence is more often found in small schools In 2001, where classroom identification is available: Schools with 1 or 2 classrooms 9.5% significant misadministration Schools with 6 or more classrooms 3.2% significant misadministration
School Administration InfluenceA more frequent element in misadministration Administration influence 2001 0% - 2008 27% - 38% The low probability of the SGA results suggest that the influence is directed by one person or under the direction of one person. When the number of students in the SGA is large (i.e. > 30), the source of the influence is likely to be outside of the classroom – i.e. the school administration. Expanded sample The SGA method has been applied to a substantially expanded sample of schools, yet on a selective, non-random basis. The goal is to expand the number of observed cases of significant influence to evaluate their nature. The frequency of significant influence in the expanded sample is similar to the random sample and illustrates a marked difference in the number of test-takers involved in the SGA from 2001 to 2008.
DiscussionIt’s not the teachers or the tests – it’s the system. Misadministration of high-stakes tests is a major part of the problem of volatility in test score results. Misadministration of high-stakes tests preceded NCLB at a modest, but significant, level and has markedly increased over 2001 to 2008 The character of misadministration has changed from the entrepreneurial efforts of individual teachers to more often include the direct participation of school administrators. Misadministration includes many forms of deviation from standardized procedures, including informal strategies to raise scores recommended by test-prep writers and school authorities, leaving a fuzzy line for where cheating begins. Principals and teachers are not given thorough instructions on test administration do’s and don’ts. - and are left to sort out informal recommendations, invent, and scramble during test administration sessions.