Download
1 / 18
180 likes | 344 Views
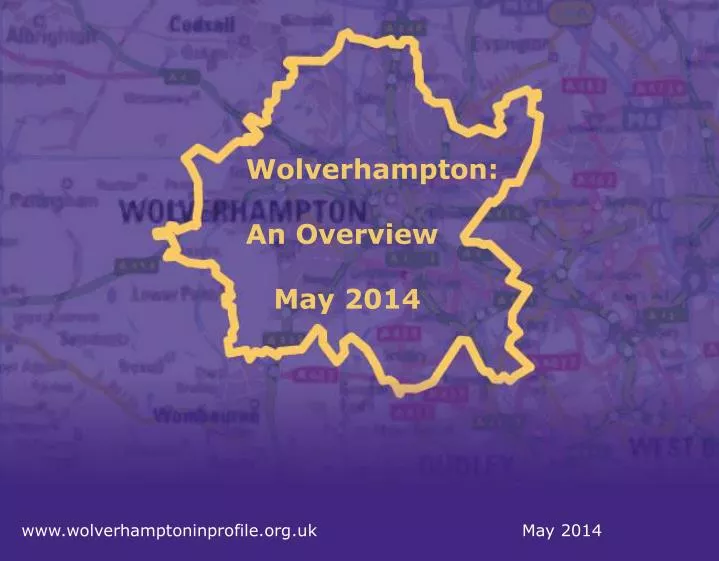
Wolverhampton: An Overview May 2014. www.wolverhamptoninprofile.org.uk. May 2014. Wolverhampton in brief. Situated to the west of Birmingham, Wolverhampton is one of the 4 local authorities in the Black Country sub-region (see map) Documented history dating back to 985 AD

E N D
Wolverhampton: • An Overview • May 2014 • www.wolverhamptoninprofile.org.uk • May 2014
Wolverhampton in brief • Situated to the west of Birmingham, Wolverhampton is one of the 4 local authorities in the Black Country sub-region (see map) • Documented history dating back to 985 AD • Centre of woollen trade in 14th and 15th centuries • Rapid growth in the 19th century based on coal and manufacturing industries • Amongst the most densely populated local authority areas in England: 249,470 people (2011 Census) living in its 26.8 square miles. • Over a third of the population are of non-’White British’ ethnicity (35.5% as of the 2011 Census) • The map shows the location of the Black Country within Great Britain and is from http://www.bcll.org.uk/
Population trends • Broadly mirrors UK population • Total population: 249,470 • Slow growth model • Rising older population – • (increased life expectancy) • Wolverhampton has rising fertility rates, which is beginning to increase lower age bands • 102,177 households in the city, 5,055 more households since 2001, a 5.2% increase • Source: 2011 Census
Total population (2011) • The total population rose from 236,582 in 2001 to 249,470 in 2011, a 5.5% rise • The greatest numbers of people are usually found in the inner city, the north-east, and the south-east • The high total population in some small areas (LSOAs) means high population density, which is especially marked in some deprived LSOAs • Source: 2011 Census
Children (0-15) (2011) • The child population fell from 49,501 in 2001 to 49,423 in 2011, a 0.15% fall • St Peter’s, Bushbury South & Low Hill, Ettingshall, Fallings Park, and Heath Town all have high child populations • There are relatively few children in the west of the city, especially in Tettenhall Wightwick, Tettenhall Regis, and Park • Source: 2011 Census
Working-age (16-64) (2011) • The working-age population rose from 147,096 in 2001 to 159,418 in 2011, a 8.4% rise • St Peter’s, Wednesfield South, Ettingshall, and Heath Town all have large working-age populations • The working-age population rising is a consequence of changing demographic trends, and an overall aging population • Source: 2011 Census
Older people (65+) (2011) • The older people population rose from 39,985 in 2001 to 40,629 in 2011, a 1.6% rise • Tettenhall Regis, Tettenhall Wightwick, Bushbury North, Wednesfield North, Merry Hill, Penn, and Spring Vale all have large older people populations • This map is effectively the opposite of the children map: areas with many children tend not to have many older people, and vice versa • Source: 2011 Census
Ethnicity (2011) • This map shows the % of residents who are from BAME (Black, Asian, Minority Ethnic) groups in each LSOA. It is everyone who does not define themselves as “White British” ethnicity • BAME residents are primarily concentrated within the inner city and the south of the city • 35.5% of all residents of the city are classed as BAME • In one small area (LSOA) in Wednesfield North, 5.0% of residents were BAME, compared to 86.1% in one LSOA in Blakenhall • Source: 2011 Census
Religion (2011) • Decline in Christianity since 2001 (10 percentage-point decrease), increase in ‘no religion’ (from 11% to 20%), other groups tend to be static or show slight increases • 55.5 % Christian • 9.1 % Sikh • 3.7 % Hindu • 3.6% Muslim • 0.4 % Buddhist • 1.2 % Other religions • 20.0% No religion • 6.4% Not stated • Source: 2011 Census
Disability (2011 & 10/11 to 12/13 academic years) • Fewer statemented Special Educational Needs (SEN) children in 12/13 academic year than 11/12 - still up on 10/11 totals. • Sources: 2011 Census / Wolverhampton City Council SEN data
% of residents per social grade by ward (2011) • Working-age residents (16-64) who are: • AB (Higher (A) and intermediate (B) managerial - administrative - professional) • C1 (Supervisory - clerical - junior managerial - administrative - professional) • C2 (Skilled manual) • D (Semi-skilled & unskilled manual) • E (State benefit, & lowest grade workers) • HIGHEST • ABC1 is Tettenhall Wightwick (65.1%) • C2DE is Bushbury S. & Low Hill (73.2%) • Source: 2011 Census
Qualifications (2013) • % of working-age residents (aged 16-64) qualified at NVQ 4 equivalent and above: e.g. HND, Degree and Higher Degree level qualifications or equivalent, and those who have no qualifications • Source: Annual Population Survey
Unemployment (Mar 2014) • The recession has caused a • significant increase in the number of people receiving key out-of-work benefits in Wolverhampton (27,540 total in August 2013, the latest available) • Jobseekers Allowance (JSA) claimants in particular has risen greatly since the beginning of 2008, prior to the recession • As of March 2014, 6.5% of the city’s population claim JSA (West Mids 3.6%; Great Britain 2.9%), which is one of the highest rates nationally • Source: Office for National Statistics NOMIS Profile
Deprivation (2010) • Ranked in the Indices of Deprivation 2010 as the 20th most deprived nationally, next version due 2015 • Relatively more deprived local authority (LA) than in 2007 (28th), and is one of the 10% most deprived in England • The city has several severe pockets of deprivation, mostly concentrated around the north, centre, and south-east • 2 small areas ranked in the 1% most deprived in England, and 22 small areas in the 10% most deprived in England • As of the 2011 Census, 53% of our population live in small areas within the top 20% most deprived in England • Source: Department for Communities & Local Government (DCLG)
Population Projections (1) • Interim 2011-Based Sub-National Population Projections (SNPP) estimate the city’s population will be 260,200 by 2021, a 4.1% rise from their baseline 2011 figure – new projected figures expected in June 2014 • The balance of the population will change: an increase in the number of children, but fewer working-age people, and more older people • Slightly increasing birth rates, and inflow of migration greater than outflow, are important aspects of population growth, but decreasing mortality rates and longer life expectancies point to a steadily aging population overall • The chart overleaf shows population change by 5-year age band, detailing which groups are projected to rise and fall over the 10-year period
Population Projections (3) • 45,400 residents aged 65+ by 2021, an 11.3% increase in the size of that group between 2011 and 2021. As a consequence, there will be 7,700 total residents classified as being in the ‘oldest old’ according to the ONS (aged 85+), a group that often require specialist healthcare • Any specialist healthcare provision attached to gender (e.g. male / female only wards, prostate clinics…) will be influenced by shifting demographics. Housing provision will also need to adapt to the possible demand for older couples / lone males accommodation • Men are living longer than before, possibly increasing the number of older couples. The aging population, however, may also be likely to provide support to one another, lessening need for intervention in some cases
For more information… • Policy Team • Office of the Chief Executive • Wolverhampton City Council • You can call Polly Sharma (01902 550567), • Policy & Equalities Manager, or email • population.statistics@wolverhampton.gov.uk • www.wolverhamptoninprofile.org.uk