Download
1 / 32
320 likes | 458 Views
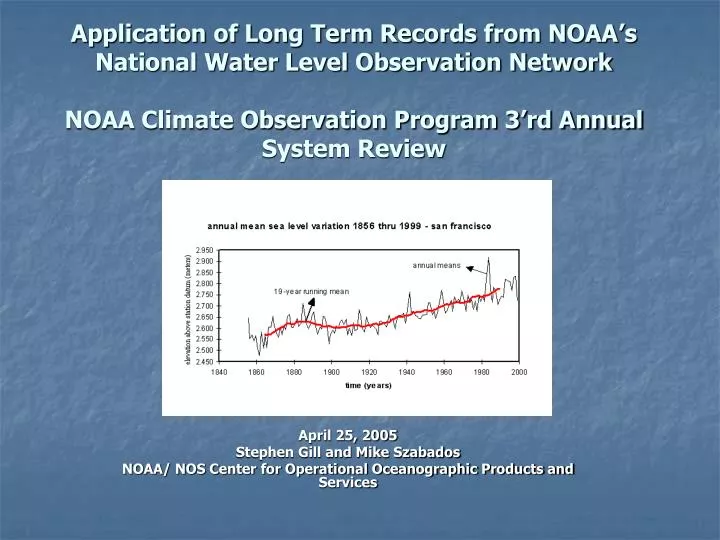
Application of Long Term Records from NOAA’s National Water Level Observation Network NOAA Climate Observation Program 3’rd Annual System Review. April 25, 2005 Stephen Gill and Mike Szabados NOAA/ NOS Center for Operational Oceanographic Products and Services.

E N D
Application of Long Term Records from NOAA’s National Water Level Observation NetworkNOAA Climate Observation Program 3’rd Annual System Review April 25, 2005 Stephen Gill and Mike Szabados NOAA/ NOS Center for Operational Oceanographic Products and Services
The NOAA National Ocean Service National Water Level Program Center for Operational Oceanographic Products and Services OPERATIONAL STATUS - GLOSS Support - Tsunami program Support APPLICATIONS - IOOS - Impacts of Sea Level Rise and Inundation Mapping - The U.S. Climate Change Science Program - Habitat Restoration - Updates of National Tidal Datum Epochs - Long-term Changes in Tidal Characteristics - Satellite Altimetry Missions - Storm Tide Exceedance Probabilties
Operational Status of NOAA National Ocean Service Tide Stations in Support of GLOSS Activities (http://tidesandcurrents.noaa.gov/) 175 NWLON stations fully operational with long-term sustained operation, documented calibration and vertical control, and routine data quality control and product delivery. 29 NWLON stations on latest official GLOSS list. 54 NWLON stations contribute to JASL Archive (Hourly Heights) maintained by UHSLC 18 NWLON stations identified as critical to sea level trends (1997 Workshop) A special sea level report is being prepared for these stations. Plans are for to have this report completed for the full 62 sea level reference stations NWLON meets or exceeds GLOSS operating requirements. NOAA NGWLMS configurations are used by many countries.
The NOAA National Ocean Service National Water Level Observation Network (NWLON) Operational Status
Planned Additions to the NWLON for Tsunami Warning - Caribbean
Building the National Backbone: A Key Federal Role 7. U.S. Contributions to the Integrated Ocean Observing System (IOOS) The national backbone provides the observational density, timeliness and locations sufficient to detect and predict changes in environmental parameters at a national scale. Data from the national backbone can be used at all scales, but most importantly supplies the essential information for national policy formulation National Water Level Observing Network – an example of a Backbone component • “End-to-End” • Built through local, regional and national partnerships • Provides real-time and archival data for a core set of parameters • Supplies data to meet national and regional resource management needs
SEA LEVELS ONLINE WEB PRODUCT Relative Sea Level Trends Monthly Mean Sea Level Anomalies 50-year mean Sea level Trends http://tidesandcurrents.noaa.gov/sltrends/sltrends.shtml
Regional Trends of Relative Mean Sea Level From NOAA Tide Stations
LOWER CHESAPEAKE BAY : Variations In Relative Annual Mean Sea Level - 1927 thru 2000 Linear Trend: +4.2mm/year Mean sea level has risen about 300mm (1 ft.) relative to the land since 1927 Elevation relative to bench mark (meters) Time (years)
WGS 84, NAD 83 (86) 3-D Datums MSL NAVD 88, NGVD 29 Orthometric Datums Tidal Datums VDATUM: TOOL FOR VERTICAL DATUM TRANSFORMATION MHHW,MHW, MTL, MLW, MLLW
Ecological Impacts of Sea Level Change North Carolina Sea Level Rise Project Create a DEM To assess Sea Level Rise NOAA Bathymetry Integrated topo/ Bathy DEM Land Elevations Areas inundated with a 1.0 m SLR
The NOAA National Ocean Service National Water Level Program, Center for Operational Oceanographic Products and Services 6. The U.S. Climate Change Science Program http://www.climatescience.gov/ Question 9.2: What are the current and potential future impacts of global environmental variability and change on human welfare, what factors influence the capacity of human societies to respond to change, and how can resilience be increased and vulnerability reduced? The Deliverable: Elevation maps depicting areas vulnerable to sea level rise and planning maps depicting how state and local governments could respond to sea level rise. The U.S. EPA provides a low resolution topographic product (1-3 meter contours). The project deliverable is to produce a high resolution (< 1.0m) contoured digital elevation product from which to overlay sea level trends suing a NOA North Carolina Sea Level Project as a national template.
G G Y Y Task Task Completion CCSP Deliverable: Sea Level Rise Director: Chet Koblinsky PM: Michael Szabados As of Dec. 31 Prime Contractors: Performance Parameters Schedule (FY) CCSP Deliverable: Coastal elevations and sensitivity to sea level rise. (Decision-support assessment/synthesis product in 2006) Budget/Funding, $K Key Issues/Risks • Issues: • The CCSP product is desired to be on a national scale. NOAA, EPA and USGS are co-leads. EPA is developing national low resolution maps of coastal vulnerability to sea level rise; however, these maps are of insufficient resolution to be of practical value to local coastal managers for impact studies. • EPA and NOAA agree that a national plan with desired resolution will not be a reality by 2005; but pilot studies like North Carolina will be used to develop national template. Final consensus on the scope of CCSP product is pending. • Risks: • NOAA has not identified resources necessary to begin a national effort at the desired resolution. The CCSP report will be a technical review and not an implemented project. CCSP Deliverable Is Executable
Application to Marsh Restoration Existing Elevations Qwuloolt Marsh, Ebey Slough Marysville, WA Variations in Relative Mean Sea Level – Seattle, WA Linear trend: +2.26 mm/yr Photo: Qwuloolt Marsh courtesy P. Leon
1983-01 EPOCH ACTUAL IDEALIZED CHANGE OF TIDAL DATUM EPOCHS
60-78 Epoch 83-01 Epoch MSL= 1.490 MSL= 1.542 MSL Linear Trend Epoch Change 0.051 m
Monitoring of Long-term Changes in Tidal Characteristics Changes in Range of Tide Changes in Time of Tide - HWI
Applications to Research into Global Sea Level Figures 2. Local comparison of hydrographic and tide gauge measured sea level change near (2a) San Francisco & San Diego, (2b) Honolulu, (2c) Balboa: (2a) As in Figure 1, but hydrographic observations limited to 4400 km by 1100 km area adjacent to gauge sites at San Francisco and San Diego; (2b) to 1100 km by 1100 km area centered on gauge site at Honolulu; (2c) to 800 km by 1400 km area adjacent to gauge site at Balboa, Panama. From: Mass and Volume Contributions to 20th Century Global Sea Level Rise Laury Miller and Bruce C. Douglas - Nature
The NOAA National Ocean Service National Water Level Program, Center for Operational Oceanographic Products and Services 5. Satellite Altimeter Mission Support NOAA has operated a tide station in cooperation with JPL/NASA on Platform Harvest since 1992 in support of TOPEX/Poseidon and Jason-1 providing data for altimeter evaluation and closure analyses. Redundant pressure gauge systems provide independent sea level estimates at the time of every 10-day overpass.
Corsica/Harvest Sea-Surface Height Bias Estimates A Decade of Monitoring TOPEX/POSEIDON and Jason-1 Source – Bruce Haines
Monthly Highest and Lowest Water Levels with 99%, 50%, 10%, and 1% Annual Exceedance Probability Levels
MEAN SEA LEVEL TREND AT BALTIMORE, MARYLAND The mean sea level trend is 3.12 millimeters/year (1.02 feet/century) with a standard error of 0.08 mm/yr based on monthly mean sea level data from 1902 to 1999.
Comparison of Storm Surge at Baltimore Maryland 1933 Hurricane The Two Most Extreme Events 2004 Hurricane Isabel
Comparison of Observed and Predicted Water Levels During Two Most Extreme Hurricanes at Baltimore 1933 HURRICANE 2003 HURRICANE ISABEL
Monthly Highest Observed Water Levels at Baltimore Relative to Highest Water Level Observed During Hurricane Isabel 1933 Hurricane shows lower absolute water level, but when corrected for sea level rise, shows a higher value than 2003 during Hurricane Isabel: Thus, at Baltimore, the 1933 Hurricane actually had a stronger storm surge than Hurricane Isabel even though it was lower in elevation relative to the land due to sea level rise since 1933.
APPLICATIONS ARE MADE POSSIBLE BY OPERATING STANDARDS: • Station Operation - sustained long-term O&M - continuous data - documented vertical stability • Vertical Datum Reference - up-to-date references to latest tide (and water level) and geodetic datums - water levels are known relative to the land and local bench marks - precise connection to geodetic datums • Data Collection, Processing and Data Delivery - data and system quality control on 24x7 basis - real-time data and near-real time data are available with QC flags - monthly and yearly data products are routinely derived and applied - web-based delivery of all data and products - data archival system