Download
1 / 44
450 likes | 625 Views
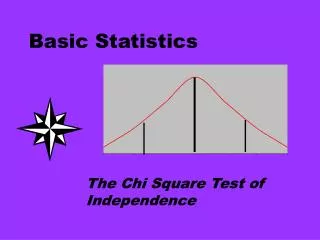
Basic statistics. European Molecular Biology Laboratory Predoc Bioinformatics Course 17 th Nov 2009 Tim Massingham, tim.massingham@ebi.ac.uk. Introduction. Basic statistics What is a statistical test Count data and Simpson’s paradox A Lady drinking tea and statistical power

E N D
Basic statistics European Molecular Biology Laboratory Predoc Bioinformatics Course 17th Nov 2009 Tim Massingham, tim.massingham@ebi.ac.uk
Introduction Basic statistics What is a statistical test Count data and Simpson’s paradox A Lady drinking tea and statistical power Thailand HIV vaccine trial and missing data Correlation Nonparametric statistics Robustness and efficiency Paired data Grouped data Multiple testing adjustments Family Wise Error Rate and simple corrections More powerful corrections False Discovery Rate
What is a statistic Anything that can be measured Calculated from measurements “If your experiment needs statistics, you ought to have done a better experiment.” Ernest Rutherford “Statistical thinking will one day be as necessary for efficient citizenship as the ability to read and write.” H.G.Wells “He uses statistics as a drunken man uses lamp-posts, for support rather than illumination.” Andrew Lang (+others) Branches of statistics Frequentist Neo-Fisherian Bayesian Lies Damn lies (and each of these can be split further) Classical statistics
Repeating the experiment Imagine repeating experiment, some variation in statistic Initial experiment 1,000 times 100 times 10,000 times
Frequentist inference Repeated experiments at heart of frequentist thinking Have a “null hypothesis” Null distribution What distribution of statistic would look like if we could repeatedly sample Compare actual statistic to null distribution Likely Unlikely Classical statistics Finding statistics for which the null distribution is known
Anatomy of a Statistical Test Density of null distribution Value of statistic P-value of test Probability of observing statistic or something more extreme Equal to area under the curve Density measures relative probability Total area under curve equals exactly one
Some antiquated jargon Dates back to when we used tables Old way Calculate statistic Look up critical values for test Report “significant at 99% level” Or “rejected null hypothesis at ….” Critical values Pre-calculated values (standard normal distribution)
Power Power Probability of correctly rejecting null hypothesis (for a given size) Power changes with size Accept null Reject null Null distribution An alternative distribution
Confidence intervals Use same construction to generate confidence intervals Confidence interval = region which excludes unlikely values For the null distribution, the “confidence interval” is the region which we accept the null hypothesis. The tails where we reject the null hypothesis are the critical region
Count data (Almost) the simplest form of data we can work with Each experiment gives us a discrete outcome Have some “null” hypothesis about what to expect Example: Are all jelly babies equally liked by PhD students?
Chi-squared goodness of fit test Summarize results and expectations in a table jelly_baby <- c( 19, 27, 15, 22, 17) expected_jelly <- c(20,20,20,20,20) chisq.test( jelly_baby, p=expected_jelly, rescale.p=TRUE ) Chi-squared test for given probabilities data: jelly_baby X-squared = 4.4, df = 4, p-value = 0.3546 pchisq(4.4,4,lower.tail=FALSE) [1] 0.3546
Chi-squared goodness of fit test jelly_baby <- c( 19, 27, 15, 22, 17) expected_jelly <- c(20,20,20,20,20) chisq.test( jelly_baby, p=expected_jelly, rescale.p=TRUE ) Chi-squared test for given probabilities data: jelly_baby X-squared = 4.4, df = 4, p-value = 0.3546 What’s this? How much do we need to know to reconstruct table? Number of samples Any four of the observations or equivalent, ratios for example
More complex models Specifying the null hypothesis entirely in advance is very restrictive 4 df 0 df Allowed expected models that have some features from data e.g. Red : Green ratio Each feature is one degree of freedom 4 df 1 df 16.2:23.8 = 15:22 16.2+23.8 = 40
Example: Chargaff’s parity rule Chargaff’s 2nd Parity Rule In a single strand of dsDNA, %A≈%T and %C≈%G Helicobacter pylori From data, %AT = 61% %CG=39% Apply Chargaff to get %{A,C,G,T} Null hypothesis has one degree of freedom Alt. hypothesis has three degrees of freedom Difference: two degrees of freedom
Contingency tables Observe two variables in pairs - is there a relationship between them? Silly example: is there a relationship desserts and toppings? A test of row / column independence Real example McDonald-Kreitman test - Drosophila ADH locus mutations
Contingency tables A contingency table is a chi-squared test in disguise × n Null hypothesis: rows and columns are independent Multiply probabilities × n
Contingency tables Observed: three degrees of freedom (a, b & c) Expected: two degrees of freedom (p & q) Chi-squared test with one degree of freedom In general, for a table with r rows and c columns Observed: rc - 1 degrees of freedom Expected: (r-1) + (c-1) degrees of freedom Difference: (r-1)(c-1) degrees of freedom
Bisphenol A • Bisphenol A is an environmental estrogen monomer • Used to manufacture polycarbonate plastics • lining for food cans • dental sealants • food packaging Many in vivo studies on whether safe: could polymer break down? Is the result of the study independent of who performed it? F vomSaal and C Hughes (2005) An Extensive New Literature Concerning Low-Dose Effects of Bisphenol A Shows the Need for a New Risk Assessment. Environmental Health Perspectives 113(8):928
Bisphenol A Observed table E.g. 0.817 × 0.904 ×115 = 85.0 Expected table Chi-squared statistic = 48.6. Test with 1 d.f. p-value = 3.205e-12
Bisphenol A Association measure Discovered that we have dependence How strong is it? Chi-squared statistic Coefficient of association for 2×2 table Number of observations Number between 0 = independent to 1 = complete dependence For the Bisphenol A study data Should test really be one degree of freedom? Reasonable to assume that government / industry randomly assigned? Perhaps null model only has one degree of freedom pchisq(48.5589, df=1, lower.tail=FALSE) [1] 3.205164e-12 pchisq(48.5589, df=2, lower.tail=FALSE) [1] 2.854755e-11
Simpson’s paradox Famous example of Simpson’s paradox C R Charig, D R Webb, S R Payne, and J E Wickham (1986) Comparison of treatment of renal calculi by open surgery, percutaneousnephrolithotomy, and extracorporeal shockwave lithotripsy. BMJ 292: 879–882 • Compare two treatments for kidney stones • open surgery • percutaneousnephrolithotomy (surgery through a small puncture) 78% success 83% success Percutaneousnephrolithotomy appears better (but not significantly so, p-value 0.15)
Simpson’s paradox Missed a clinically relevant factor: the size of the stones The order of treatments is reversed Combined Open 78% Perc. neph. 83% Small kidney stones 93% success 87% success p-value 0.15 Large kidney stones 73% success 69% success p-value 0.55
Simpson’s paradox What’s happened? Failure of randomisation (actually an observational study) Small and large stones have a different prognosis (p-value<1.2e-7) Small Large Small kidney stones 93% success 87% success Open 72% success total Large kidney stones 73% success 69% success Prec. neph 88% success total
The Lady Tasting Tea Fisher, R. A. (1956) Mathematics of a Lady Tasting Tea “A LADY declares that by tasting a cup of tea made with milk she can discriminate whether the milk or the tea infusion was first added to the cup … Our experiment consists in mixing eight cups of tea, four in one way and four in the other, and presenting them to the subject for judgment in a random order. The subject has been told in advance of what the test will consist, namely that she will be asked to taste eight cups, that these shall be four of each kind, and that they shall be presented to her in a random order.” • Eight cups of tea • Exactly four one way and four the other • The subject knows there are four of each • The order is randomised
Fisher’s exact test Looks like a Chi-squared test • But the experiment design fixes the marginal totals • Eight cups of tea • Exactly four one way and four the other • The subject knows there are four of each • The order is randomised Fisher’s exact test gives exact p-values with fixed marginal totals Often incorrectly used when marginal totals not known
Sided-ness Not interested if she can’t tell the difference Two possible ways of being significant, only interested in one Exactly right Exactly wrong
Sided-ness Only interested in significantly greater Just use area in one tail More wrong More correct tea <- rbind( c(0,4) , c(4,0) ) tea [,1] [,2] [1,] 0 4 [2,] 4 0 fisher.test(tea)$p.value [1] 0.02857143 fisher.test(tea,alternative="greater")$p.value [1] 1 fisher.test(tea,alternative="less")$p.value [1] 0.01428571
Statistical power Are eight cups of tea enough? A perfect score, p-value 0.01429 Better than chance, p-value 0.2429
Statistical power Assume the lady correctly guesses proportion p of the time • To investigate • simulate 10,000 experiments • calculate p-value for experiment • take mean
Thailand HIV vaccine trial News story from end of September 2009 “Phase III HIV trial in Thailand shows positive outcome” 16,402 heterosexual volunteers tested every six months for three years fisher.test(hiv) Fisher's Exact Test for Count Data data: hiv p-value = 0.04784 alternative hypothesis: true odds ratio is not equal to 1 95 percent confidence interval: 0.4721409 0.9994766 sample estimates: odds ratio 0.689292 16,395 Rerks-Ngarm, Pitisuttithum et al. (2009) New England Journal of Medicine 10.1056/NEJMoa0908492
Thailand HIV vaccine trial Significant? Would you publish? Should you publish? "Oh my God, it's amazing. " … "The significance that has been established in this trial is that there is a 5% chance that this is a fluke. So we are 95% certain that what we are seeing is real and not down to pure chance. And that's great." • Study was randomized (double-blinded) • Deals with many possible complications • male / female balance between arms of trial • high / low risk life styles • volunteers who weren’t honest about their sexuality (or changed their mind mid-trial) • genetic variability in population (e.g. CCL3L1) • incorrect HIV test / samples mixed-up • vaccine improperly administered
Thailand HIV vaccine trial Significant? Would you publish? Should you publish? "Oh my God, it's amazing. " … "The significance that has been established in this trial is that there is a 5% chance that this is a fluke. So we are 95% certain that what we are seeing is real and not down to pure chance. And that's great." A multiple testing issue? Initially published data based on modified Intent To Treat Intent To Treat People count as soon as they are enrolled in trial modified Intent To Treat Excluded people found to sero +ve at beginning of trial Per-Protocol Only count people who completed course of vaccines How many unsuccessful HIV vaccine trials have there been? One or more and these results are toast.
Missing data Some people go missing during / drop out of trials This could be informative E.g. someone finds out they have HIV from another source, stops attending check-ups Double-blinded trials help a lot Extensive follow-up, hospital records of death etc Missing Completely At Random Missing data completely unrelated to trial Missing At Random Missing data can be imputed Missing Not At Random Missing data informative about effects in trial
Correlation? Various types of data and their correlation coefficients Wikimedia, public domain http://commons.wikimedia.org/wiki/File:Correlation_examples.png
Correlation does not imply causation • If A and B are correlated then one or more of the following are true • A causes B • B causes A • A and B have a common cause (might be surprising) Do pirates cause global warming? R. Matthews (2001) Storks delivery Babies (p=0.008) Teaching Statistics22(2):36-38 Pirates: http://commons.wikimedia.org/wiki/File:PiratesVsTemp_English.jpg
Pearson correlation coefficient Standard measure of correlation “Correlation coefficient” Measure of linear correlation, statistic belongs to [-1,+1] 0 independent 1 perfect positive correlation -1 perfect negative correlation cor.test( gene1, gene2, method="pearson") Pearson's product-moment correlation data: gene1 and gene2 t = 851.4713, df = 22808, p-value < 2.2e-16 alternative hypothesis: true correlation is not equal to 0 95 percent confidence interval: 0.9842311 0.9850229 sample estimates: cor 0.984632 Measure of correlation Roughly proportion of variance of gene1 explained by gene2 (or vice versa)
Pearson: when things go wrong A single observation can change the outcome of many tests Pearson correlation is sensitive to outliers Pearson’s correlation test Correlation = -0.05076632(p-value = 0.02318) Correlation = -0.06499109 (p-value = 0.003632) Correlation = -0.1011426 (p-value = 5.81e-06) Correlation = 0.1204287 (p-value = 6.539e-08) 200 observations from normal distribution x ~ normal(0,1) y ~ normal(1,3)
Spearman’s test Nonparametric test for correlation Doesn’t assume data is normal Insensitive to outliers Coefficient has roughly same meaning Replace observations by their ranks Raw expression cor.test( gene1, gene2, method="spearman") Spearman's rank correlation rho data: gene1 and gene2 S = 30397631415, p-value < 2.2e-16 alternative hypothesis: true rho is not equal to 0 sample estimates: rho 0.984632 Ranks
Comparison Look at gene expression data cor.test(lge1,lge2,method="pearson") Pearson's product-moment correlation data: lge1 and lge2 t = 573.0363, df = 22808, p-value < 2.2e-16 alternative hypothesis: true correlation is not equal to 0 95 percent confidence interval: 0.9661278 0.9678138 sample estimates: cor 0.9669814 cor.test(lge1,lge2,method="spearman") Spearman's rank correlation rho data: lge1 and lge2 S = 30397631415, p-value < 2.2e-16 alternative hypothesis: true rho is not equal to 0 sample estimates: rho 0.984632 cor.test(lge1,lge2,method="kendall") Kendall's rank correlation tau data: lge1 and lge2 z = 203.0586, p-value < 2.2e-16 alternative hypothesis: true tau is not equal to 0 sample estimates: tau 0.8974576
Comparison Spearman and Kendall are scale invariant Log - Log scale Pearson 0.97 Spearman 0.98 Kendall 0.90 Normal - Log scale Pearson 0.56 Spearman 0.98 Kendall 0.90 Normal - Normal scale Pearson 0.99 Spearman 0.98 Kendall 0.90