Download
1 / 2
20 likes | 153 Views
AN ASSESSSMENT OF SHORELINE CHANGE FOR SMALL ASSOCIATED ISLANDS OF PUERTO RICO AND THE UNITED STATES VIRGIN ISLANDS. Session 247—Poster 84.

E N D
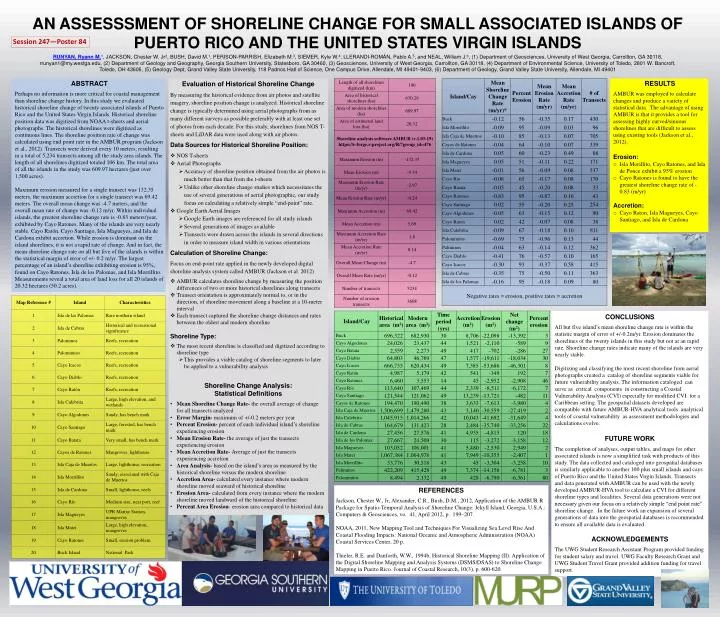
AN ASSESSSMENT OF SHORELINE CHANGE FOR SMALL ASSOCIATED ISLANDS OF PUERTO RICO AND THE UNITED STATES VIRGIN ISLANDS Session 247—Poster 84 RUNYAN, Ryann M.1, JACKSON, Chester W. Jr2, BUSH, David M.1, PERISON-PARRISH, Elizabeth M.3, SIEMER, Kyle W.4, LLERANDI-ROMÁN, Pablo A.5, and NEAL, William J.6, (1) Department of Geosciences, University of West Georgia, Carrollton, GA 30118, rrunyan1@my.westga.edu, (2) Department of Geology and Geography, Georgia Southern University, Statesboro, GA 30460, (3) Geosciences, University of West Georgia, Carrollton, GA 30118, (4) Department of Environmental Science, University of Toledo, 2801 W. Bancroft, Toledo, OH 43606, (5) Geology Dept, Grand Valley State University, 118 Padnos Hall of Science, One Campus Drive, Allendale, MI 49401-9403, (6) Department of Geology, Grand Valley State University, Allendale, MI 49401 ABSTRACT Perhaps no information is more critical for coastal management than shoreline change history. In this study we evaluated historical shoreline change of twenty associated islands of Puerto Rico and the United States Virgin Islands. Historical shoreline position data was digitized from NOAA t-sheets and aerial photographs. The historical shorelines were digitized as continuous lines. The shoreline position rate of change was calculated using end point rate in the AMBUR program (Jackson et al., 2012). Transects were derived every 10 meters, resulting in a total of 5,234 transects among all the study area islands. The length of all shorelines digitized totaled 106 km. The total area of all the islands in the study was 609.97 hectares (just over 1,500 acres). Maximum erosion measured for a single transect was 132.35 meters, the maximum accretion for a single transect was 69.42 meters. The overall mean change was -4.7 meters, and the overall mean rate of change was -0.12 m/yr. Within individual islands, the greatest shoreline change rate is -0.83 meters/year, exhibited by CayoRatones. Many of the islands are very nearly stable. CayoRatón. Cayo Santiago, Isla Magueyes, and Isla de Cardona exhibit accretion. While erosion is dominant on the island shorelines, it is not a rapid rate of change. And in fact, the mean shoreline change rate on all but five of the islands is within the statistical margin of error of +/- 0.2 m/yr. The largest percentage of an island’s shoreline exhibiting erosion is 95%, found on CayoRatones, Isla de los Palomas, and Isla Morrillito. Measurements reveal a total area of land loss for all 20 islands of 20.32 hectares (50.2 acres). • Evaluation of Historical Shoreline Change • By measuring the historical evidence from air photos and satellite imagery, shoreline position change is analyzed. Historical shoreline change is typically determined using aerial photographs from as many different surveys as possible preferably with at least one set of photos from each decade. For this study, shorelines from NOS T-sheets and LiDAR data were used along with air photos. • Data Sources for Historical Shoreline Position: • NOS T-sheets • Aerial Photographs • Accuracy of shoreline position obtained from the air photos is much better than that from the t-sheets • Unlike other shoreline change studies which necessitates the use of several generations of aerial photographic, our study focus on calculating a relatively simple “end-point” rate. • Google Earth Aerial Images • Google Earth images are referenced for all study islands • Several generations of images available • Transects were drawn across the islands in several directions in order to measure island width in various orientations • Calculation of Shoreline Change: • Focus on end-point rate applied in the newly developed digital shoreline analysis system called AMBUR (Jackson et al. 2012) • AMBUR calculates shoreline change by measuring the position differences of two or more historical shorelines along transects • Transect orientation is approximately normal to, or in the direction, of shoreline movement along a baseline at a 10-meter interval • Each transect captured the shoreline change distances and rates between the oldest and modern shoreline • Shoreline Type: • The most recent shoreline is classified and digitized according to shoreline type • This provides a viable catalog of shoreline segments to later be applied to a vulnerability analysis • Shoreline Change Analysis: • Statistical Definitions • Mean Shoreline Change Rate- the overall average of change for all transects analyzed • Error Margin- maximum of +/-0.2 meters per year • Percent Erosion- percent of each individual island’s shoreline experiencing erosion • Mean Erosion Rate- the average of just the transects experiencing erosion • Mean Accretion Rate- Average of just the transects experiencing accretion • Area Analysis- based on the island’s area as measured by the historical shoreline versus the modern shoreline • Accretion Area- calculated every instance where modern shoreline moved seaward of historical shoreline • Erosion Area- calculated from every instance where the modern shoreline moved landward of the historical shoreline • Percent Area Erosion- erosion area compared to historical data • RESULTS • AMBUR was employed to calculate changes and produce a variety of statistical data. The advantage of using AMBUR is that it provides a tool for assessing highly curved/sinuous shorelines that are difficult to assess using existing tools (Jackson et al., 2012). • Erosion: • Isla Morillito, CayoRatones, and Isla de Ponce exhibit a 95% erosion • CayoRatones is found to have the greatest shoreline change rate of -0.83 (m/yr) • Accretion: • Cayo Raton, Isla Magueyes, Cayo Santiago, and Isla de Cardona CONCLUSIONS All but five island’s mean shoreline change rate is within the statistic margin of error of +/-0.2m/yr. Erosion dominates the shorelines of the twenty islands in this study but not at an rapid rate. Shoreline change rates indicate many of the islands are very nearly stable. Digitizing and classifying the most recent shoreline from aerial photographs created a catalog of shoreline segments viable for future vulnerability analysis. The information cataloged can serve as critical components in constructing a Coastal Vulnerability Analysis (CVI) especially for modified CVI for a Caribbean setting. The geospatial datasets developed are compatible with future AMBUR-HVA analytical tools analytical tools of coastal vulnerability as assessment methodologies and calculations evolve. Future Work The completion of analyses, output tables, and maps for other associated islands is now a simplified task with products of this study. The data collected and cataloged into geospatial databases is similarly applicable to another 100 plus small islands and cays of Puerto Rico and the United States Virgin Islands. Transects and data generated with AMBUR can be used with the newly developed AMBUR-HVA tool to calculate a CVI for different shoreline types and localities. Several data generations were not necessary given our focus on a relatively simple “end point rate” shoreline change. In the future work an expansion of several generations of data into the geospatial databases is recommended to ensure all available data is evaluated. Acknowledgements The UWG Student Research Assistant Program provided funding for student salary and travel. UWG Faculty Research Grant and UWG Student Travel Grant provided addition funding for travel support. References Jackson, Chester W., Jr, Alexander, C.R., Bush, D.M., 2012, Application of the AMBUR R Package for Spatio-Temporal Analysis of Shoreline Change: Jekyll Island, Georgia, U.S.A.: Computers & Geosciences, vo. 41, April 2012, p. 199–207. NOAA, 2011, New Mapping Tool and Techniques For Visualizing Sea Level Rise And Coastal Flooding Impacts: National Oceanic and Atmospheric Administration (NOAA) Coastal Services Center, 20 p. Thieler, R.E. and Danforth, W.W., 1994b, Historical Shoreline Mapping (II): Application of the Digital Shoreline Mapping and Analysis Systems (DSMS/DSAS) to Shoreline Change Mapping in Puerto Rico. Journal of Coastal Research, 10(3), p. 600-620.
Location of Study Islands 5. CayoIcacos 3. Palominos 2. Isla de Cabras 4. Palominitos 1. Isla de Palomas 2 1 5 6 3 8 4 7 9 10 19 11 16 15 17 18 13 12 • 7. CayoRatón 14 • 6. Cayo Diablo 20 • 9. CayoAlgodones • 8. Isla Culebrita 13. Isla Caja de Muertos 11. CayoBatata 12. Cayo de Ratones 14. Isla Morrillito 15. Isla de Cardona • 10. Cayo Santiago 20. Buck Island 17. Isla Magueyes 18. Isla Matei 19. CayoRatones 16. Cayo Rio