Download
1 / 25
250 likes | 452 Views
The full dynamic short-run model. J. M. Keynes. Chairman Bernanke. The full Keynesian model of the business cycle. i. r. IS-MP. Y. π e. u. Y pot. Potential output = AF(K,L). π. 2. The Dynamic Model. This is state-of-the-art modern Keynesian model Short-run model of business cycles

E N D
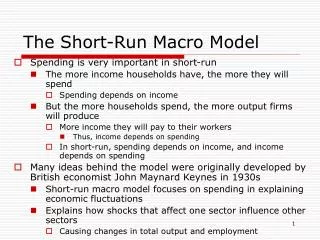
The full dynamic short-run model J. M. Keynes Chairman Bernanke
The full Keynesian model of the business cycle i r IS-MP Y πe u Ypot Potential output = AF(K,L) π 2
The Dynamic Model This is state-of-the-art modern Keynesian model Short-run model of business cycles Combines - IS (consumption, investment, fiscal, later trade) - MP (Taylor rule) - Phillips curve Closed economy
The Taylor rule 1. John Taylor suggested the following rule to implement the dual mandate: (TR) i t = πt + r* + θπ(πt - π*) +θYyt Here r* is the equilibrium real interest rate, π inflation rate, π* is inflation target, y is output gap (Y - Y*), θπ and θYare parameters. 2. Has both normative* and predictive** power. ____________________ *Theoretical point: Can be derived from minimizing loss function such as L = λπ(πt - π*) 2 + λ Y (lnYt - lnY* ) 2 ** We showed this last time with empirical Taylor rule, predictions and actual (see next slide).
Full Dynamic IS-MP analysis Key equations: 1. Demand for goods and services: yt = - αrtb + μ*Gt + εt 2. Business real interest rate: rtb = it – πte + σt= rt+ σt 3. Phillips curve: πt = πte + φyt + ηt 4. Inflation expectations: πe t = π t-1 5. Monetary policy: i t = πt + r* + θπ(πt - π*) +θYyt , i > 0 Notes: • Equation (1) is our IS curve from last time with risk. • Phillips curve in (3) substitutes y for u by Okun’s Law • Business interest rate is real short rate plus risk and term premium (σt ) • Jones uses simplified version of these: no risk and other. • Jones solves for AS-AD as function of inflation; we stick with interest rates.
Algebra of Dynamic IS-MP analysis Solution of equations: (IS) yt = μ*Gt- α( it– πte + σt) + εt (MP) i t = [φ(1+ θπ) +θY ] yt+ r* - θπ π* +(1+ θπ)( πte + ηt) This is derived by substitution. Check my algebra.
Interpretation of Dynamic IS-MP (IS) yt= μ*Gt- α( it – πte + σt) + εt (MP) i t = [φ(1+ θπ) +θY ] yt+ r* - θπ π* + (1+ θπ)( πte + ηt) A = standard multiplier on spending B = risk enters in as negative element on investment C = slope of MP due to inflation and output term in Taylor rule D = lower inflation target raises Fed interest rates E = expected inflation or inflation shock raises Fed interest rate. A B C E D
The graphics of dynamic IS-MP Federal funds rate MP(πe, π*, r*, ηt) it* IS(πe, G, εt , σt ) Yt Yt = real output (GDP)
1. What are the effects of fiscal policy? • A fiscal policy is change in purchases (G) or in taxes (T0,τ), holding monetary policy constant. • In normal times, because MP curve slopes upward, expenditure multiplier is reduced due to crowding out.
IS shock (as in fiscal expansion) MP i IS(G’) IS(G) Y = real output (GDP)
Multiplier Estimates by the CBO Congressional Budget Office, Estimated Impact of the ARRA, April 2010
MP(ηt > 0) Inflationary shock MP(ηt = 0) i it** IS Yt** Y = real output (GDP)
Dual mandate v single mandate Taylor rule for ECB versus the Fed: (Fed) it = πt + r* + θπ(πt - π*) +θYyt (EBC) it = πt + r* + θπ(πt - π*) Therefore MP curve steeper for ECB: (MP) i t = [φ(1+ θπ) + θY] yt+ r* - θπ π* + (1+ θπ)( πte + ηt)
ECB v Fed Note added after class: I had the slopes backwards. The Fed is steeper (higher coefficient). Eating arithmetic humble pie. Note the interest rate diagram is explained by this.
IS shock (Fed v. ECB) MP (Fed) i MP (ECB) IS(G’) IS(G) Y = real output (GDP)
Prediction: Fed should respond more to IS shocks such as those of 2001 - 2012
What about in the “liquidity trap” or “zero interest rate bound”
US in current recession Policy has hit the “zero lower bound” four years ago.
Japan short-term interest rates, 1994-2012 Liquidity trap from 1996 to today: 16 years and counting.
Fiscal policy in liquidity trap r = real interest rate IS’ IS MP re Y = real output (GDP)
Monetary expansion in liquidity trap r = real interest rate IS MP’ MP re Y = real output (GDP)
Can you see why macroeconomists emphasize the importance of fiscal policy in the current environment? “Our policy approach started with a major commitment to fiscal stimulus. Economists in recent years have become skeptical about discretionary fiscal policy and have regarded monetary policy as a better tool for short-term stabilization. Our judgment, however, was that in a liquidity trap-type scenario of zero interest rates, a dysfunctional financial system, and expectations of protracted contraction, the results of monetary policy were highly uncertain whereas fiscal policy was likely to be potent.” Lawrence Summers, July 19, 2009
Summary on IS-MP Model This is the workhorse model for analyzing short-run impacts of monetary and fiscal policy Key assumptions: - Inflexible prices - Unemployed resources Now on to analysis of Great Depression in IS-MP framework.