Download
1 / 21
210 likes | 300 Views
Global expression analysis. Monday 10/1: Intro * 1 page Project Overview Due Intro to R lab Wednesday 10/3: Stats & FDR - * read the paper! Monday 10/8: Calling differentially expressed genes with baySeq - *read the paper! baySeq lab for RNA-seq data

E N D
Global expression analysis Monday 10/1: Intro * 1 page Project Overview Due Intro to R lab Wednesday 10/3: Stats & FDR - * read the paper! Monday 10/8: Calling differentially expressed genes with baySeq - *read the paper! baySeq lab for RNA-seq data Wednesday 10/10: Clustering analysis Monday 10/15: Clustering analysis Clustering lab Wednesday 10/17: Motif analysis Monday 10/12: Motif analysis Motif lab Wednesday 10/14: ChIP/RIP/Nuc/Ect-Seq
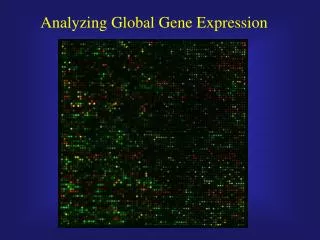
Global expression analysis Goal: To measure transcript abundance of every gene in your organism at once … AND make sense out of it The power is in organizing genomic expression data to find meaningful patterns &groups of genes
What kinds of information can we extract from genomic expression data? • Hypothetical functions for uncharacterized genes • -- genes encoding subunits of multi-subunit protein complexes • are often highly coregulated • example: ribosomal protein genes, proteasome genes in yeast • -- genes involved in the same cellular processes are often coregulated • New roles for characterized genes • 3. Better understanding of the experimental conditions • -- based on expression patterns of characterized genes • 4. Implications of gene regulation • -- WT vs. mutants can identify transcription factor targets • -- promoter analysis of coregulated genes = upstream elements • -- gene coregulation with known pathway targets can implicate • pathway activity • Understanding developmental pathways • 6. Defining samples based on expression profiles • example: comparing tumor samples from patients 4
Technologies for Quantifying & Identifying Nucleic Acids DNA microarrays Deep sequencing • Collect RNA • Generate fluorescently-labeled • cDNA • Hybridize to array • Detect fluorescence emission • with scanning laser • Data: Continuous measurements of • relative fluorescence • Collect RNA • Make strand-specific cDNA library • Deep sequence short reads • Relate sequences back to • genome / transcriptome location • (or de novo assembly) • Data: Number of sequencing reads per • each base in the genome = • Discrete ‘Counts’
Tiled-genome arrays cover the entire genome mRNA ORF Array Probes
Tiled genomic arrays (Nimblegen, Affymetrix, Agilent) Tiled sequences across each gene / locus To get relative differences in expression across two samples: 1. Need to normalize array signals across arrays 2. Need to compress measurements to a single score for each gene/transcript
Tiled genomic arrays (Nimblegen, Affymetrix, Agilent) PM MM PM = ‘perfect match’ oligo MM = ‘mismatch’ oligo (central nucleotide is mutated) ‘Robust Multiarray Analysis’ (RMA Irizarry et al. 2003) 1. On Affy: Throw out elements where MM signal > PM signal … but otherwise ignore MM 2. Local background subtraction from each probe intensity 3. Quantile normalization of arrays to be compared … sets the distribution of probe intensities to be the same 4. Convert intensity values to log2 scale 5. Use a linear model to fit a given probe set and compute one expression value per gene
Deep sequencing for gene expression analysis Old protocol: make ds cDNA Sequence New protocols: 1st strand cDNA (2nd strand with dUTP) mRNA Sequence Number of sequencing reads per region ~= number of starting transcripts
Number of sequencing reads per region ~= number of starting transcripts BUT … have to account for the length of the gene/transcript: Counts per base pair Total reads in lane 40 x 106 32 x 106 * But sometimes one lane of sequencing works better than others: Simple normalization: Avg counts within gene length / Total Counts in That Lane RPKM: Reads Per Kb per Million mapped reads
Another challenge: mapping reads to the genome/transcriptome DNA Should you restrict yourself to ORF annotations? Spliced transcript DNA intron Can map reads to genome or transcriptome sequence, or assemble de novo.
Comparing samples via fold-changes: RPKM across samples reflects Differential Expression Usually work in log2 space
Now each sample = list of normalized relative transcript values Array 1 Array 2
Assessing replicates: how well do the data agree overall? linear regression Where does the noise come from? -- can be biological variation -- can be array artifacts … should define both types of variation …
Now you have your data, in the form of relative log2 expression differences Now what?
Select differentially expressed genes to focus on Methods of gene selection: -- arbitrary fold-expression-change cutoff example: genes that change >3X in expression between samples -- statistically significant change in expression requires replicates Gene X expression under condition 1 Gene X expression under condition 2 Expression difference
Select differentially expressed genes to focus on Methods of gene selection: -- arbitrary fold-expression-change cutoff example: genes that change >3X in expression between samples -- statistically significant change in expression requires replicates Gene X expression under condition 1 Gene X expression under condition 2 Expression difference
Select differentially expressed genes to focus on Methods of gene selection: -- arbitrary fold-expression-change cutoff example: genes that change >3X in expression between samples -- statistically significant change in expression requires replicates Use statistics to compare the mean & variation of 2 (or more) populations Expression difference
Test if the means of 2 (or more) groups are the same or statistically different The ‘null hypothesis’ H0 says that the two groups are statistically the same -- you will either accept or reject the null hypothesis Choosing the right test: parametric test if your data are normally distributed with equal variance nonparametric test if neither of the above are true Why do the data need to be normally distributed?
Test if the means of 2 groups are the same or statistically different The ‘null hypothesis’ H0 says that the two groups are statistically the same -- you will either accept or reject the null hypothesis If your two samples are normally distributed with equal variance, use the t-test T = X1 – X2 difference in the means SED standard error of the difference in the means If T > Tc where Tc is the critical value for the degrees of freedom & confidence level, then reject H0 Notice that if the data aren’t normally distributed mean and standard deviation are not meaningful.
Differential expression on DNA microarrays: Bioconductor package Limma (ref) • Load your data • Provide a ‘target’ file that says which samples are on which arrays • Provide a ‘design’ file (and in some cases a ‘contrast matrix’) to specify • which samples you want to compare • Limma will look at the entire dataset and model the error on the data, to try • to over-come measurement error • Limma then does a modified T-test to identify genes with significant expression • differences across the samples you specified. ** See previous years’ limma lab for a walk-through example