Download
1 / 36
360 likes | 430 Views
Mobile Bay Water Quality Assessment Using NASA Spaceborne Data Products. Jenny Q. Du Mississippi State University. Outline. Project Objectives Current Research Status Proposed Approaches Images with higher resolution Classification methods Preliminary Results Ongoing Efforts.

E N D
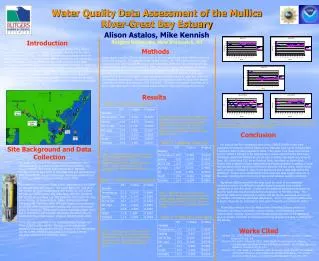
Mobile Bay Water Quality Assessment Using NASA Spaceborne Data Products Jenny Q. Du Mississippi State University
Outline • Project Objectives • Current Research Status • Proposed Approaches • Images with higher resolution • Classification methods • Preliminary Results • Ongoing Efforts
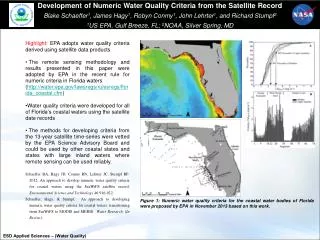
Project Objectives • To use NASA Spaceborne Imagery (i.e., Landsat, ASTER, Hyperion) in the study of water quality and sediment dynamics in Mobile Bay, AL. • To compare with the NASA research products in Mobile Bay using MODIS imagery and assess the improvements.
This MODIS satellite image shows sediment plumes moving into the Gulf of Mexico from the main branch of the Mississippi River and through the bayous in its Delta region (visibleearth.nasa.gov)
Current Research Status • MODIS (Aqua/Terra) • Pros: wide spatial coverage, high temporal resolution (covers the entire globe almost everyday) • Con: low spatial resolution (250m-1000m) • Hard classification • K-means clustering • ISODATA
Proposed Approaches • Satellite Images with Higher Resolutions • LANDSAT • 30 m spatial resolution (can be enhanced to 15m); 4 VNIR bands • ASTER • 15m spatial resolution; 3 VNIR bands • Hyperion • 30m spatial resolution; 220 bands • Fine Classification • Statistical Classifiers • Correlation Study with Ground Truth • In situ sampling (Nov. 2007 – Sep. 2008) • Historic data
Preliminary Results • Satellite Images with Higher Resolutions • LANDSAT • Classification • ISODATA • Correlation Study with Ground Truth • Historic data (e.g., Water Resources Database)
Observation Stations Class 5 Class 4 Class 3 Class 2 Class 1 Land (Hard) Classification Result
Observation Stations Class 5 Class 4 Class 3 Class 2 Class 1 Land Turbidity Stations1=5.1 Stations2=4.7
Observation Stations Class 5 Class 4 Class 3 Class 2 Class 1 Land Turbidity Stations3=20 Stations4=25
Observation Stations Class 5 Class 4 Class 3 Class 2 Class 1 Land Turbidity Stations5=9.8 Stations6= 10.3
Observation Stations Class 5 Class 4 Class 3 Class 2 Class 1 Land Turbidity Stations7=27
Satellite Image 09/26/1991Ground Truth(Turbidity) 09/27/1991
Observation Stations Class 5 Class 4 Class 3 Class 2 Class 1 Land (Hard) Classification Result
Observation Stations Class 5 Class 4 Class 3 Class 2 Class 1 Land Turbidity Stations1=5.1 Stations2=5.5 Stations3=3.3 Stations4=4.4 Stations5=4.0 TSS Stations1=24 Stations2=22 Stations3=17 Stations4=19 Stations5=16 CHL-A Stations1=5.5 Stations2=7.0 Stations3=6.8 Stations4=4.4 Stations5=7.9
Observation Stations Class 5 Class 4 Class 3 Class 2 Class 1 Land Turbidity Stations6=7.9 TSS Stations6=43 CHL-A Stations6=37
Observation Stations Class 5 Class 4 Class 3 Class 2 Class 1 Land (Hard) Classification Result
Observation Stations Class 5 Class 4 Class 3 Class 2 Class 1 Land Turbidity Stations1=18
Satellite Image 02/17/2001Ground Truth(Turbidity) 02/08/2001
Proposed Approaches (Cont’d) • Classification Approaches r = Ma • Unsupervised Linear Mixture Analysis • Endmember signature extraction • Fully constrained linear unmixing • Blind Source Separation • Independent Component Analysis
The (soft) endmember classification map that can be used for detailed water quality mapping
The independent component (soft classification map) that can be used for detailed water quality mapping
Ongoing Efforts • More detailed correlation analysis • Images and ground truth data collected at the same time. • Images collected during Nov. 2007 and Sep. 2008.