Download
1 / 40
410 likes | 618 Views
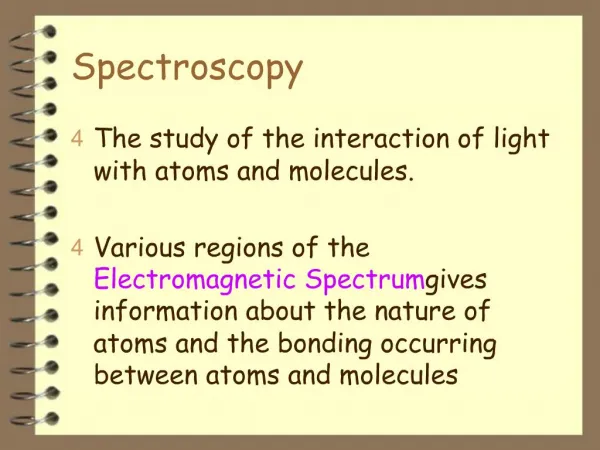
SPECTROSCOPY. Introduction of Spectrometric Analyses. The study how the chemical compound interacts with different wavelenghts in a given region of electromagnetic radiation is called spectroscopy or spectrochemical analysis.

E N D
Introduction of Spectrometric Analyses The study how the chemical compound interacts with different wavelenghts in a given region of electromagnetic radiation is called spectroscopy or spectrochemical analysis. The collection of measurements signals (absorbance) of the compound as a function of electromagnetic radiation is called a spectrum.
Energy Absorption The mechanism of absorption energy is different in the Ultraviolet, Infrared, and Nuclear magnetic resonance regions. However, the fundamental process is the absorption of certain amount of energy. The energy required for the transition from a state of lower energy to a state of higher energy is directly related to the frequency of electromagnetic radiation that causes the transition.
Spectral Distribution of Radiant Energy Wave Number (cycles/cm) X-Ray UV Microwave Visible IR 200nm 400nm 800nm Wavelength (nm)
Electromagnetic Radiation V = Wave Number (cm-1) l = Wave Length C = Velocity of Radiation (constant) = 3 x 1010 cm/sec. u = Frequency of Radiation (cycles/sec) The energy of photon: h (Planck's constant) = 6.62 x 10⁻²⁷ (Ergsec) C = u
Spectral Properties, Application and Interactions of Electromagnetic Radiation Type Radiation Type spectroscopy Type Quantum Transition Energy Wave Number V Wavelength λ Frequency υ Kcal/mol eV cm-1 cm Hz Gamma ray Gamma ray emission Nuclear X-ray absorption, emission Electronic (inner shell) X-ray Ultra violet Electronic (outer shell) UV absorption Visible IR absorption Infrared Molecular vibration Molecular rotation Microwave absorption Micro-wave Magnetically induced spin states Nuclear magnetic resonance Radio
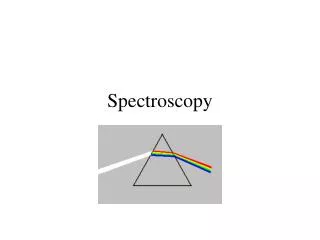
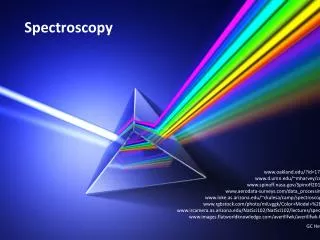
Dispersion of Polymagnetic Light with a Prism Prism - Spray out the spectrum and choose the certain wavelength (l) that you want by slit.
Ultra Violet Spectrometry The absorption of ultraviolet radiation by molecules is dependent upon the electronic structure of the molecule. So the ultraviolet spectrum is called electronic spectrum.
Electronic Excitation The absorption of light energy by organic compounds in the visible and ultraviolet region involves the promotion of electrons in , , and n-orbitals from the ground state to higher energy states. This is also called energy transition. These higher energy states are molecular orbitals called antibonding.
Electronic Molecular Energy Levels The higher energy transitions (*) occur a shorter wavelength and the low energy transitions (*, n *) occur at longer wavelength.
Chromophore is a functional group which absorbs a characteristic ultraviolet or visible region. UV 210 nm Double Bonds 233 nm Conjugated Diene 268 nm Conjugated Triene 315 nm Conjugated Tetraene
Spectrophotometer An instrument which can measure the absorbance of a sample at any wavelength.
Fluorometer Instrument to measures the intensity of fluorescent light emitted by a sample exposed to UV light under specific conditions. Emit fluorescent light Antibonding s ' as energy decreases p ' Antibonding s n-> ' p n-> ' Nonbonding n p ->p ' Ground state p Bonding s ->s Energy ' s Bonding Electron's molecular energy levels UV Light Source Detector Monochromator Monochromator ° 90 C Sample
H C S C H C H C H 3 2 2 3 Food Compound
Chromophore is a functional group which absorbs a characteristic ultraviolet or visible region. UV 210 nm Double Bonds 233 nm Conjugated Diene 268 nm Conjugated Triene 315 nm Conjugated Tetraene
Beer – Lambert Law As the cell thickness increases, the transmitted intensity of light of I decreases.
R- Transmittance R = I0 - Original light intensity I- Transmitted light intensity % Transmittance = 100 x Absorbance (A) = Log = Log = 2 - Log%T Log is proportional to C (concentration of solution) and is also proportional to L (length of light path through the solution). I0 1 I T I I I I0 I0 I0
A CL = ECL by definition and it is called the Beer - Lambert Law. A = ECL A = ECL E = Molar Extinction Coefficient ---- Extinction Coefficient of a solution containing 1g molecule of solute per 1 liter of solution
UNITS A = ECL A = No unit (numerical number only)
L = Cm C = Moles/Liter
Steps in Developing a Spectrometric Analytical Method • Run the sample for spectrum • 2. Obtain a monochromatic wavelength for the maximum absorption wavelength. • 3. Calculate the concentration of your sample using Beer Lambert Equation: A = ECL 2.0 Absorbance 0.0 350 450 250 300 400 200 Wavelength (nm)
x nm 1.0 x A at 280 0.5 x 4 1 2 3 5 Concentration (mg/ml) There is some A vs. C where graph is linear. NEVER extrapolate beyond point known where becomes non-linear.
Spectrometric Analysis Using Standard Curve 1.2 0.8 A at 540 nm 0.4 3 1 4 2 Concentration (g/l) glucose Avoid very high or low absorbencies when drawing a standard curve. The best results are obtained with 0.1 < A < 1. Plot the Absorbance vs. Concentration to get a straight line
Sample Cells UV Spectrophotometer Quartz (crystalline silica) Visible Spectrophotometer Glass
Light Sources UV Spectrophotometer 1. Hydrogen Gas Lamp 2. Mercury Lamp Visible Spectrophotometer 1. Tungsten Lamp
Chemical Structure & UV Absorption Chromophoric Group ---- The groupings of the molecules which contain the electronic system which is giving rise to absorption in the ultra-violet region.
Chromophoric Structure Group Structure nm Carbonyl > C = O 280 Azo -N = N- 262 Nitro -N=O 270 Thioketone -C =S 330 Nitrite -NO2 230 Conjugated Diene -C=C-C=C- 233 Conjugated Triene -C=C-C=C-C=C- 268 Conjugated Tetraene -C=C-C=C-C=C-C=C- 315 Benzene 261
UV Spectrometer Application Protein Amino Acids (aromatic) Pantothenic Acid Glucose Determination Enzyme Activity (Hexokinase)
Flurometric Application Thiamin (365 nm, 435 nm) Riboflavin Vitamin A Vitamin C
Visible Spectrometer Application Niacin Pyridoxine Vitamin B12 Metal Determination (Fe) Fat-quality Determination (TBA) Enzyme Activity (glucose oxidase)
Practice Examples 1. Calculate the Molar Extinction Coefficient E at 351 nm for aquocobalamin in 0.1 M phosphate buffer. pH = 7.0 from the following data which were obtained in 1 Cm cell. SolutionC x 105 MIoI A 2.23 100 27 B 1.90 100 32 2. The molar extinction coefficient (E) of compound riboflavin is 3 x 10³ Liter/Cm x Mole. If the absorbance reading (A) at 350 nm is 0.9 using a cell of 1 Cm, what is the concentration of compound riboflavin in sample?
3. The concentration of compound Y was 2 x 10⁻⁴ moles/liter and the absorption of the solution at 300 nm using 1 Cm quartz cell was 0.4. What is the molar extinction coefficient of compound Y? 4. Calculate the molar extinction coefficient E at 351 nm for aquocobalamin in 0.1 M phosphate buffer. pH =7.0 from the following data which were obtained in 1 Cm cell. SolutionC x 105 MI0I A 2.0 100 30
Spectroscopy Homework • A substance absorbs at 600 nm and 4000 nm. What type of energy transition most likely accounts for each of these absorption processes? • 2. Complete the following table. • [X](M) Absorbance Transmittance(%) E(L/mole-cm) L(cm) • 30 2000 1.00 • 0.5 2500 1.00 • 2.5 x 10⁻³ 0.2 1.00 • 4.0 x 10⁻⁵ 50 5000 • 2.0 x 10⁻⁴ 150 • [X](M) = Concentration in Mole/L
3. The molar absorptivity of a pigment (molecular weight 300) is 30,000 at 550 nm. What is the absorptivity in L/g-cm. 4. The iron complex of o-phenanthroline (Molecular weight 236) has molar absorptivity of 10,000 at 525 nm. If the absorbance of 0.01 is the lowest detectable signal, what concentration in part per million can be detected in a 1-cm cell?