Download
1 / 8
330 likes | 853 Views
Double Bar Graphs. Re-cap. What are the different types of graphs we have learned about? What are some of the things are graph must include? What is the difference between a line graph and a bar graph?. How Many Pets. # of Studnets Owners. Bar Graphs.

E N D
Re-cap... • What are the different types of graphs we have learned about? • What are some of the things are graph must include? • What is the difference between a line graph and a bar graph?
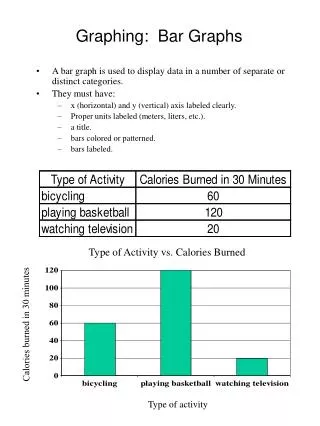
How Many Pets # of Studnets Owners Bar Graphs • The horizontal axis shows the categories of data (i.e. – eye colours) • The vertical axis shows the amount of data. The amounts can be shown as consecutive (1,2,3,etc.) or in intervals (2,4,6,8,etc.) Types of Pets r
On Your Bar Graph You Must Have • A Title • Labels on both axes • Categories and amounts on the axes • And your data shown in vertical bars
If I wanted to survey the class, and I wanted to show the differences in results from the boys and girls, what would be the best suited graph to display this data?
Double Bar Graphs Popular Movie Genres • The two bars represent different parts of the data. For example, girls and boys or different grades. This makes it easier to compare the two sets of data. • Like the bar graph, the vertical axis shows the amount of data and the horizontal axis shows the categories of data. For an example, look at the graph. Number of Students Favourite Movie Genre
What do you Need on Your Double Bar Graph? On your double bar graph, you need… • Labels on the axes • A title • 2 bars per category •A legend, showing what each bar represents Don‘t forget: The two bars represent different parts of the data. For example, girls and boys. This helps you to compare your data more easily.
Horse Back Riding Sports Hockey Soccer Girls Boys 5 4 3 2 1 0 1 2 3 4 5 Number of Students Sliding Bar Graphs Sports Students Participate In • The vertical axis shows the categories of data (sports, in this case) • The horizontal axis shows the amounts (students) • The bars showing the data are in a horizontal line with their category, and the way that the data is read is from the 0 on the horizontal axis line, reading one way for one bar, the other way for the other bar