Download

1 / 14
140 likes | 233 Views
6.5 Inequalities. L E S S O N. 6. 5. In the Real World. Solving Inequalities. Bumper Cars You must be at least 130cm tall to ride the bumper cars. This can be represented by the inequality h ³ 130. L E S S O N. 6 5. In the Real World. Solving Inequalities.

E N D
L E S S O N 6. 5 In the Real World Solving Inequalities Bumper Cars You must be at least 130cm tall to ride the bumper cars. This can be represented by the inequality h³ 130.
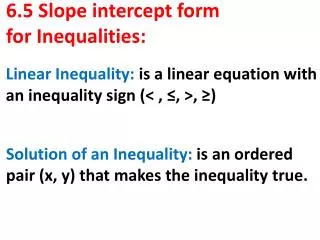
L E S S O N 6 5 . In the Real World Solving Inequalities Bumper Cars You must be at least 130cm tall to ride the bumper cars. This can be represented by the inequality h³ 130. An inequality is a mathematical sentence formed by placing an inequality symbol between two expressions. The solution of an inequality is the set of numbers that you can substitute for the variable to make the inequality true. The graph of an inequality in one variable is the set of points on a number line that represents the solution of the inequality.
Solving Inequalities L E S S O N 6 5 . –2 1 –3 –1 0 3 2 –4 4 1 EXAMPLE Graphing Inequalities x < 2 All numbers less than 2
Solving Inequalities L E S S O N 6 5 . 2 1 –3 –2 –1 0 3 4 –4 –3 –2 –1 0 3 2 –4 4 1 1 EXAMPLE Graphing Inequalities x < 2 All numbers less than 2 x£ –1 All numbers less than or equal to –1
Solving Inequalities L E S S O N 6 5 . –3 4 –4 2 3 –1 4 –2 –3 1 1 0 –1 –2 3 –4 2 0 0 –1 –2 3 1 4 –4 2 –3 1 EXAMPLE Graphing Inequalities x < 2 All numbers less than 2 x£ –1 All numbers less than or equal to –1 x > 0 All numbers greater than 0
Solving Inequalities L E S S O N 7 6 . 4 –1 0 –3 –2 –1 0 1 –4 –4 4 1 –3 –2 2 3 2 3 0 –4 –4 4 3 –3 –2 –1 0 1 4 2 2 1 –3 3 –2 –1 1 EXAMPLE Graphing Inequalities x < 2 All numbers less than 2 x£ –1 All numbers less than or equal to –1 x > 0 All numbers greater than 0 x³ –2 All numbers greater than or equal to –2
Solving Inequalities L E S S O N 6 5 . Equivalent inequalities are inequalities that have the same solution. You can produce an equivalent inequality in the following ways: • Add or subtract the same number on each side. • Multiply or divide each side by the same positive number. 1 < 3 Multiply each side by 2. 2 < 6
Solving Inequalities L E S S O N 6 5 . –2 0 1 4 2 –3 5 –1 3 2 EXAMPLE Solving an Inequality Solve d – 2 £ 1. Then graph the solution. d – 2 £ 1 Write inequality. d – 2 + 2£ 1 + 2 Add 2 to each side. d£ 3 Simplify. To graph d£ 3, use a closed dot and draw the arrow pointing to the left.
Solving Inequalities L E S S O N 6 5 . 5 –3 3 4 1 0 –1 –2 2 ? 0 – 2 £ 1 CHECK 2 EXAMPLE Solving an Inequality Solve d – 2 £ 1. To check the solution d£ 3, choose any number less than or equal to 3 to substitute for d. The check below uses d = 0. Then graph the solution. d – 2 £ 1 Write original inequality. d – 2 + 2 £ 1 + 2 Add 2 to each side. d – 2 £ 1 Write original equation. d£ 3 Simplify. Substitute 0 for d. –2 £ 1 To graph d£ 3, use a closed dot and draw the arrow pointing to the left. Solution checks.
Solving Inequalities L E S S O N 6 5 . 3 5 6 9 7 2 10 4 8 3 EXAMPLE Solving an Inequality Solve 5 + y <13 Then graph the solution. Write original inequality. 5 + y < 13 5 + y- 5< 13 - 5 Subtract 5 to each side. y < 8 Simplify. To graph y < 8, use an open dot and draw the arrow pointing to the left.
Solving Inequalities L E S S O N 6 5 . –3 2 –2 –1 5 1 4 3 0 4 EXAMPLE Solving an Inequality Solve a – 3 > -5 Then graph the solution. Write original inequality. a – 3 > -5 a – 3 + 3> -5 + 3 Add 3 to each side.. a > -2 Simplify. To graph a > -2use a closed dot and draw the arrow pointing to the right.
Solving Inequalities L E S S O N 6 5 . 10 3 9 7 8 5 4 11 6 5 EXAMPLE Solving an Inequality Solve 3 t > 12 Then graph the solution. Write original inequality. 3 t > 12 3 t > 12 Divide each side by 3.. 3 3 Simplify. t > 4 To graph t > 4use an open dot and draw the arrow pointing to the right.
Solving Inequalities L E S S O N 6 5 . 11 3 9 10 7 6 5 4 8 6 EXAMPLE Solving an Inequality Solve 3x + 5 < 23 Then graph the solution. Write original inequality. 3x + 5 < 23 3x + 5 < 23 -5 -5 Subtract 5 on each side 3x < 18 Simplify. Divide both sides by 3 and simplify x < 6 To graph x < 6use an open dot and draw the arrow pointing to the left. Assignment: p. 248 9 - 22