Download

1 / 19
190 likes | 193 Views
Third progress report on cohesion 17 May 2005. Towards a new partnership for growth, jobs and cohesion. The report contains 3 parts. Analysis of economic and social disparities in the enlarged EU EU cohesion policy and the Lisbon Strategy in 2000-2006

E N D
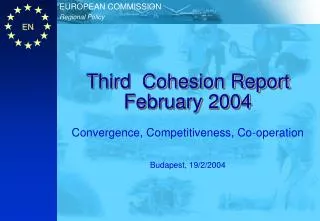
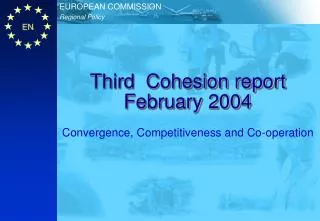
Third progress report on cohesion 17 May 2005 Towards a new partnership for growth, jobs and cohesion
The report contains 3 parts • Analysis of economic and social disparities in the enlarged EU • EU cohesion policy and the Lisbon Strategy in 2000-2006 • The future of cohesion policy and the Growth and Jobs Agenda Structure
Disparity levels Disparities in GDP per head between EU-25 still considerable (2003): • Latvia – 41% of EU average • Ireland – 132% of EU average • Luxembourg – 215% of EU average • New Member States – below 90% of EU average Part I
GDP per head in PPS in 2003 Part I
Regional disparities • Regional disparities remain high (2002) • 189% of the EU-25 average in the 10 most prosperous regions • 36% in the 10 least prosperous ones. • Over 1/4 of the EU’s population in 64 regions have GDP per head below 75% of EU average. • 90% of population in the new Member States living in regions with GDP per head below 75% of EU average • 13% of population in EU-15 living in regions with GDP per head below 75% of EU average Part I
<50 Regional Disparities in EU27 GDP per head in % in PPP (2002) 50 - 75 75 - 90 90 - 100 100 - 125 125 Index, EUR-27 = 100
< 1.48 HU = 1995-2001 Regional GDP Growth 1995-2002 Average growth rate in % 1.48 – 2.18 2.18 – 2.75 2.75 – 3.62 >= 3.62 no data EUR-27 = 2.25
Employment rates • Employment rates – well short of the 70% Lisbon target • 62.9% for the EU25 in 2003 • Denmark, Sweden, the Netherlands and the UK – only MS with 70% • 22 million additional jobs needed to meet 70% target • In the new Member States, 7 million additional jobs needed to meet 70% target (increase of ¼) • 200 of the 254 EU regions are below the target rate • almost 15% of the population lives in regions where the rate is below 55% • employment rates remain low among most of the least prosperous regions. Part I
< 55 55 - 60 60 - 65 65 - 70 70 - 75 >= 75 no data Regional Employment Rates 2003 Employed persons between 15 und 65 in % EUR-27 = 62.5
Productivity: recent improvements • strong productivity growth in recent years but still noticeable differences: • less than 30% of the EU25 average in Poland and the three Baltic states • 150% in Luxembourg and Ireland. • productivity was below 25% of the EU average in 15 regions • but…link between productivity and GDP • productivity exceeds the EU average regions with above-average per capital GDP Part I
< 0.45 0.45 – 0.8 0.8 – 1.16 1.16 – 1.88 >= 1.88 no data Regional Expenditure in Research and Development 2002 in % of GDP EUR-27 = 1.92
Trends in disparities • since the mid-1990s, average EU growth growth has average just over 2% per year • regional disparity levels are higher than national disparities but are also falling • 10% of EU25 population living in poorest regions (2.2% of total GDP in 2002; 1.5% in 1995) • still high levels of internal disparities Part I
Convergence objective Regions > 75% in EU25) Objective 'Regional Competitiveness and Employment' Geographical Eligibility for Structural Funds Support 2007-2013 Draft April 2005, GDP/head 2000-2001-2002 Convergence objective statistically affected regions Objective 'Regional Competitiveness and Employment' Phasing-in regions, "naturally" above 75% Index EU 25= 100 Source: Eurostat
Cohesion policy and the Lisbon Agenda • Growing orientation of SF programmes towards Lisbon objectives (above 50% in some programmes) • significantly higher in relatively more prosperous regions but lower in the less developed regions • Decentralised delivery system key to develop synergies with Lisbon • More ownership of the Lisbon strategy through cohesion policy Part II
Mid-term review • Mid-term evaluations – more emphasis on Lisbon • Allocation of the performance reserve. Over €8 billion allocated to successful programmes or priorities • Objective 1 – continues to be oriented towards transport and other infrastructure • some Member States with large Objective 1 areas - more emphasis seems to have been placed on research and innovation • Objective 2 – more emphasis on economic growth and competitiveness • Both Obj. 1 and 2 - education and vocational training continues to be important Part II
Spring European Council – March 2005 • Explicit endorsement of importance of cohesion policy as an instrument for achieving the Lisbon strategy. Key recommendations: • Community resources, including cohesion policy, should be mobilised for 3 dimensions of the strategy – economic, social and environmental. • Regional and local actors should take greater ownership of the strategy • Greater synergies between Community funds and the EIB in R&D Part III
Spring European Council – March 2005 (cont.) Key recommendations (continued): • Reduction in the general level of state aid • Investment in infrastructure • Create more jobs with more active employment policies. • Integrated guidelines to be issued at Community-level; • MS to establish national reform programmes on growth and jobs Part III
Community Strategic Guidelines 2007-2013 • Commission proposals for 2007-2013 - more strategic approach targeted on growth and jobs • Strategic Guidelines established at Community level by Council decision • Basis for National Strategic Reference Framework - to define clear priorities for MS and regions • synergies between cohesion policy and the Lisbon strategy • consistency with the Broad Economic Policy Guidelines and the European Employment Strategy • Consistency with other Community policies and priorities would be enhanced Part III
Timetable May 2005: Commission proposal on 2007-2013 Strategic Guidelines June 2005: Decision by Council on Financial Perspectives Draft Community Strategic Guidelines adopted by Commission Autumn 2005: - Decision by Council and European Parliament on cohesion policy regulations - Community Strategic Guidelines published - Preparation of National Strategic Reference Frameworks 2006: Preparation of programmes for period 2007-2013 1 Jan 2007: Implementation begins Next stages