Download
1 / 29
290 likes | 385 Views
Star Formation: From Cores to Disks. Neal J. Evans II and The c2d Team. Star Formation in Larger Clouds. Where do stars form in large molecular clouds? How efficient is star formation? What is distribution over traditional classes for a complete, unbiased sample?

E N D
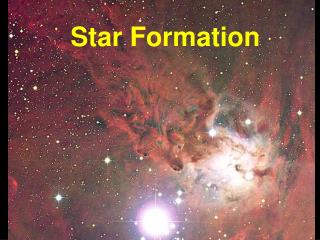
Star Formation: From Cores to Disks Neal J. Evans II and The c2d Team
Star Formation in Larger Clouds • Where do stars form in large molecular clouds? • How efficient is star formation? • What is distribution over traditional classes for a complete, unbiased sample? • Modifications to traditional classes? • Large cloud surveys with c2d, Bolocam, and COMPLETE • Will focus on Perseus and Serpens as examples
Perseus Molecular Cloud CO, 13CO, 1 mm dust continuum, AV Ridge et al. (2006); Enoch et al. (2006) 10 pc
A Rich, but Contaminated, Sample • Serpens as example (0.85 sq deg) • 377,456 total sources • 104,099 in High Reliability Catalog • 91,555 with at least 3 bands (2MASS-MIPS) • 57,784 stars • 208 candidate star forming galaxies • 262 candidate YSOs (0.3%) • 235 (90%) certified YSOs by human examination
3.86 sq deg 0.05 sq deg Trimmed to match Perseus Class I Class II Colors Separate Stars Joergensen et al. 2006 But note that we miss PMS stars without IR excess And galaxies can have similar colors to YSOs
Eradicating galaxies New set of criteria to remove exgal vermin (P. Harvey) Applied to full 5.3 sq. deg. of SWIRE ELAIS-N1. Only 2 false YSOs! If extincted and resampled to match Serpens, no false YSOs. More generally, predicts 0 to 1 per sq. deg. YSO candidates Point-like galaxies Blue are extended galaxies Stars removed already AGB stars
Most YSOs Separate Well “Probability” that source is a galaxy, based on location in cc, cm diagrams. Purely empirical. Most Serpens YSOs separate well, but there is a tail of ambiguous sources in Serpens. Harvey et al. 2007
How Low in Luminosity? Completeness assessed by comparing full SWIRE and SWIRE resampled to Serpens extinction and sensitivity. Dotted line shows corrections. Note: L = 10–2 is L expected for H-burn limit at age of 2 Myr Luminosity Function for YSOs in Serpens, with and without completeness corrections. Harvey et al. 2007
How Low do they Go? • Secure YSOs down to L(1-30 micron) ~ 10–2 Lsun • Possible YSOs to 10–3 Lsun • How to separate from extra-galactic vermin? • Need to add other wavebands • Complementary project by Allers, Jaffe • See talk by Allers later this AM.
Efficiencies • Much more complete sample • Complete down to about 10–1.5 Lsun • Uniform photometry • Caveats • Only Serpens and Cha II have been hand-checked • We may be missing: • Very low luminosity embedded sources • If not detected in all IRAC bands • See Poster P2-6 by Dunham • More evolved PMS (no significant IR excess)
Overall Star Formation Rates SFR assumes <M*> = 0.5 Msun; tSF = 2 Myr
Comparison to Dense Gas M*(tot) assumes <M*> = 0.5 Msun; Depletion time: tdep = Mdense/SFR Mdense is total mass in dense cores from 1 mm maps.
How “Efficient” is Star Formation? • Not very for the cloud as a whole • 1% to 4% of mass with AV > 2 is in dense cores • (Enoch et al. 2007) • 2% to 4% is in stars (assume <M*> = 0.5 Msun) • Large variations in SF rate • Perseus is 13 times more productive than Cha II • Normalized to area, Serpens is 5 times Cha II • Quite efficient in dense gas • Current TOTAL M* similar to Mdense • Depletion time is 0.6 to 3.6 Myr
Mass Functions • Need more information to get IMF • Spectral types, extinction, sort out low L,… • Work is underway • We can constrain Core Mass Function • 3 Clouds with Bolocam maps • Starless cores only • Masses from 1 mm dust • Absolute uncertainties substantial • But shape is not as sensitive
Combined starless core mass distribution Masses: TD = 10K = 0.0114cm2/g • Best fit power law: p ~ 2.5 or Lognormal • IMF: • Salpeter (p~2.4) • Chabrier 03 • (p~2.7 M>1M) “Not inconsistent” with a scenario in which stellar masses are determined during core formation Enoch et al. 2007
Evolution • First based on traditional class system • Previous studies based on small numbers • About 100 objects • Combining all our large clouds yields nearly 1000 YSOs
Class Statistics • Based on “Lada class” as extended by Greene et al.: a based on slope of nSn • Fit to any photometry between 2 and 24 microns • Preliminary!!! • Averages over different situations • Clusters, aggregates, and distributed
I 13% III 13% Flat 13% II 62% I: Flat: II: III: Overall Stats IF Class II lasts 2 Myr, AND IF star formation continuous AND IF Time is the only variable THEN Class I and Flat each last about 0.4 Myr Notes: Results depend a bit on how a is calculated Class III under-represented Class 0 mixed with Class I
Clusters vs. Distributed: Serpens Cluster boundary defined by AV = 20 contour. Dense gas mass from 1 mm continuum emission. Depletion time: tdep = Mdense/SFR; assumes <M*> = 0.5 Msun; tSF = 2 Myr
More Comparisons tcross = A0.5/v, v = 1 km/s; tcoll = (n r2 v)–1, r = 0.03 pc, v = 1 km/s n = N(cores)/Volume. tcoll is the time between core collisions.
Clusters vs. Distributed • Densities high in clusters • But < 0.1 that in Orion, … • Dense cores are more clustered than YSOs • Clusters are younger • Distributed population could come from dispersed clusters [tcross ~ t(ClassII)] • Core collisions not common at present • [tcoll ~ 10 x t(ClassI)] • Range of vLSR ~ 1.4 km/s in Serpens core • Williams and Myers (2000)
Adding Diversity to the Class System • The Class system has provided the framework for 20 years • Class 0 sources could not be seen in NIR/MIR • Tbol was introduced • Can we see them now? • Does Class II to Class III capture late evolution?
Spitzer Separating Class 0 from I Use Tbol to separate. Using a was not possible before for Class 0, but Spitzer can see many Class 0 in MIR. a versus Tbol. Good agreement for Tbol > 300, but poor for Tbol < 300. Class 0 can have large range of a and not monotonic. Enoch et al. In prep.
Diversity in disk SEDs Traditional III III, then flat III, then rising Some excesses start only at long wavelengths but are substantial: We call these cold disks (see P3-4 by J. Brown et al.) The traditional transition from II to III does not capture the diversity seen in disk SEDs (see P3-10 by I. Oliveira et al.)
aexcess lturn-off New 2D classification scheme Two parameters needed lturn-off: last wavelength without excess aexcess: SED slope for l>lturn-off
Gap opening Grain growth cTTs: lturn-off < 2 mm; aexcess ~ –1 wTTS: lturn-off > 2 mm; aexcess –3 to 1
Summary • Efficiencies in clouds are low • For making dense cores or YSOs • Efficiencies in dense cores are high • Core Mass Function similar to IMF shape • With assumptions, can constrain t(Class) • But we need to add diversity…
Combined starless core mass distribution 110 Starless cores All three clouds Vertical line is 50% in Perseus (worst one) Power law fit to M>0.8 Msun Lognormal to M>0.2 Msun (so includes incomplete bins) Reduced chi-sq = 3.6 (PL); 0.7 (LN) Mean size 1.4 x 10³ AU Mean density 3 x 105 cm–3 Enoch et al. 2007