Download
1 / 15
150 likes | 227 Views
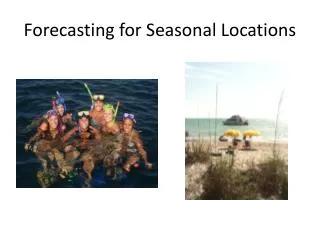
Verification Results for Global models for E. Africa locations. Laurence Wilson lawrence.wilson@ec.gc.ca WITH help from the students of the 5 th International verification methods workshop. Outline. ECMWF’s Diagnosis map for Africa

E N D
Verification Results for Global models for E. Africa locations Laurence Wilson lawrence.wilson@ec.gc.ca WITH help from the students of the 5th International verification methods workshop
Outline • ECMWF’s Diagnosis map for Africa • Results for ECMWF and NCEP models – precipitation vs. GTS data • A comparison of ECMWF and MOGREPS ensemble forecasts (From Melbourne 5 IVMW)
ECMWF Diagnostic chart: -Daily precipitation values plotted vs forecast amts.
Global model verification Sept 2010 to May, 2011 Stations available
Verification of ECMWF and NCEP precipitation forecasts • SEE spreadsheet “ECMWF-NCEP verif results” for full comparison graphs • RESULTS summary: • Both models overforecast small amounts of precipitation; NCEP more so than ECMWF • ECMWF seriously underforecasts higher amounts of precipitation, highest forecast value is less than 50 mm • NCEP attempts to forecast up to 100 mm, but not accurately • Accuracy (according to hit rate and ETS) is low for both, but ECMWF outperforms NCEP according to ETS, up to 10 mm. Hit rate is higher for NCEP except for 1 mm, but at the expense of significantly higher false alarm ratio. • Pierce skill score says ECMWF slightly better discrimination for 1 and 5 mm, otherwise equal • The new SEDS – same as Pierce, but easier to see differences at higher thresholds – does not go to 0
ECMWF Vs. MOGREPS Africa Cup Trevor Carey-Smith, Yinglin Li, Evgeny Atlaskin, Matthew Trueman, Anatoly Muravyev
Rules of the Match Two global ensemble prediction systems ECMWF (A-squad) MOGREPS (B-squad) One rainy season (8.5 months) 24hr precipitation accumulations MOGREPS data goes to T+144
ECMWF MOGREPS Brier Skill Scores by threshold Sample climatology reference MOGREPS remains unskilful at all forecast ranges and lead times Both models tend towards climatology
ECMWF MOGREPS ROC area skill scores by threshold Both models are skilful at all forecast ranges and thresholds Measure of a model’s ability to discriminate events from non-events MOGREPS degenerates more rapidly with increasing threshold
Summary • ECMWF beats MOGREPS • Both models show skill at discriminating • With more time, we would have looked into non ‘democratic-voting’ conversion of ensembles to probabilities • More summary: • Now have some idea of the different characteristics of global Models and eps BUT data still limited. NEXT STEP: Need to match data from each country with global model datasets