Download

1 / 22
240 likes | 393 Views
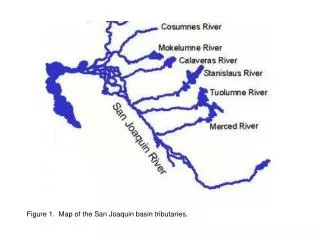
CALSIM II - San Joaquin River Basin Refinements and Results. Presentation by Dan Steiner On behalf of the San Joaquin River Group Authority March 14, 2005. Geographic Scope. New Hogan. River. Calaveras. New Melones. River. New Don Pedro. Stanislaus. Ripon. Delta-Mendota Canal.

E N D
CALSIM II - San Joaquin River Basin Refinements and Results Presentation by Dan Steiner On behalf of the San Joaquin River Group Authority March 14, 2005
Geographic Scope New Hogan River Calaveras New Melones River New Don Pedro Stanislaus Ripon Delta-Mendota Canal Vernalis California Aqueduct Maze Modesto San River Tuolumne New Exchequer Joaquin River Stevinson Merced Newman Lander River Buchanan River Chowchilla Hidden San Luis Reservoir Millerton River Fresno Delta-Mendota Canal River California Aqueduct Joaquin San Mendota Pool
CALSIM II San Joaquin River Basin Enhancements • Revised hydrology • Land use based demands for Eastside water districts and adjacent areas • Improved system operating rules • Revised mapping of Westside and Eastside connectivity • Refinement / Addition of Friant and Calaveras systems • New formulation for calculation of water quality at Vernalis
Revised Hydrology • Stream Accretions Mass balance approach using long-term gages Accounts for water entering and leaving stream reaches + Downstream Gage - Upstream Gage + Diversions - Return Flows + Runoff Adjustment • Resultant Value Represents Precipitation runoff Historical stream-groundwater interaction Gage errors
Conceptual Area Water BalanceBased on Land Use Demands CUAW from CU model Non-recoverable losses SW Returns to system GW pumping Boundary Deep percolation
Water Budgets andRepresentation of System Operations • Use historical land use to estimate consumptive use • Use historical operations data to perform water budgets • Results of water budgets are used to develop Stream diversion requirements Groundwater use parameters District Operations • Approach varies depending on available data • Validation of system operations Ensure model simulation depicts recent operations
Representation of System Operations Illustrative Example
Validation of System Operations New Don Pedro Operations
Comprehensive San Joaquin River Basin Model Calaveras River Tuolumne River Stanislaus River Chowchilla River Merced River Fresno River San Joaquin River Lander Vernalis Maze Newman Mendota Pool San Joaquin River
Comprehensive San Joaquin River Basin ModelSimple Version Including Water Quality
CALSIM II Current Conditions Test Simulation • CALSIM II fully integrated model logic, last modifications through January 2005. • Logic and results are currently under review with Reclamation • Represents current basin operations Decision 1641 Decision 1422 New Melones Interim Operations Plan San Joaquin River Agreement
CALSIM II Current Conditions Test Simulation • First, results are presented for “Maze”, the San Joaquin River upstream of the Stanislaus confluence Captures the effects of upstream operations of the Merced River and Tuolumne River, and the occasional flow from the upper San Joaquin River and Kings River Water quality estimated with new CALSIM II mass balance approach • Results are then presented for “Vernalis”, as the conditions are affected by the Stanislaus River and the operation of New Melones Captures the effects of New Melones operating to the Interim Plan of Operation, sometimes specifically for Vernalis flow and quality objectives
Simulation of San Joaquin River at MazeComparison to Previous Modeling
Simulation of San Joaquin River at MazeComparison to Previous Modeling
Simulation of San Joaquin River at VernalisStanislaus River Interim Plan of Operations
Simulation of San Joaquin River at VernalisVernalis Objectives The current water quality objective at Vernalis is a running 30-day average of 700 uS/cm for April 1 through August 31, and 1000 uS/cm for September 1 through March 31. For the February through June non-pulse period (cfs): October objectives
Simulation of San Joaquin River at VernalisNew Melones Operations and Vernalis
Simulation of San Joaquin River at VernalisVernalis Water Quality Compliance
Simulation of San Joaquin River at VernalisVernalis Flow Compliance