Download
1 / 17
180 likes | 347 Views
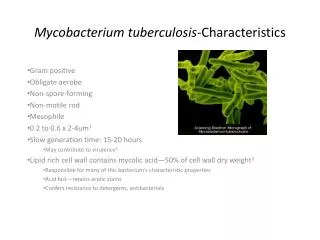
Resistance of Mycobacterium tuberculosis to antibiotics. This bacterium that causes tuberculosis has been one of the scourges of humankind Caused 25% of all deaths in New York City in 1804 Caused 33% of the deaths in Paris in the 19th century

E N D
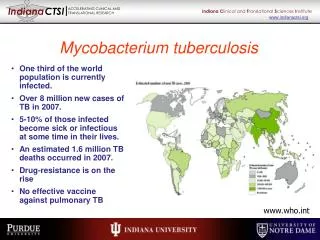
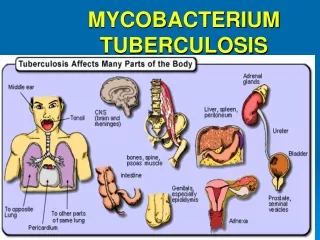
Resistance of Mycobacterium tuberculosis to antibiotics • This bacterium that causes tuberculosis has been one of the scourges of humankind • Caused 25% of all deaths in New York City in 1804 • Caused 33% of the deaths in Paris in the 19th century • It still kills more people than any other viral or bacterial disease • However, improved nutrition and sanitation caused a decline in TB in industrialized countries • The drugs rifampin and isoniazid are effective against the TB bacteria
Figure 21.6 Incidence of TB infections in 1997 (per 100,000 people) Less than 10 50-99 10-24 100-250 More than 250 25-49
In the late 1980’s, the World Health Organization declared TB a global health emergency • A number of strains of M. tuberculosis were largely or completely resistant to rifampin and isoniazid • The case of an HIV-positive man in Baltimore provides insight into the acquisition of resistance by M. tuberculosis
This man was diagnosed with an acute case of TB • A 39-month regimen of antibiotics resulted in clear x-rays of his lungs and no sign of the bacteria in his body - the antibiotics seemed to have cleared the infection • Two months later, the man was readmitted to the hospital with tuberculosis-like symptoms • Despite aggressive antibiotic treatment, the man died 10 days later
The man’s physician and his research team analyzed the DNA from the resistant M. tuberculosis from the man as well as DNA from M. tuberculosis cells taken from the man when he was first admitted • The research team sequenced much of the DNA from the two strains and found only a single difference, a point mutation at a locus that codes for a portion of RNA polymerase (the protein that transcribes DNA to mRNA) • The mutation changed a TCG codon to TTG • The mutant RNA polymerase had leucine instead of serine at the 153rd amino acid in the polypeptide chain
Rifampin acts by binding to the RNA polymerase of M. tuberculosis • The substitution of leucine for a serine apparently kept the rifampin from binding tightly to the RNA polymerase
The chain of events • The mutation arose early in the course of the infection • The mutant cells stayed at low frequency during the initial infection • After antibiotic treatment began, the mutant cells had a selective advantage • The mutant cells grew in population size, eventually causing a relapse of TB for the patient • Being resistant to rifampin, antibiotic treatment was ineffective
Did evolution by natural selection occur? • Was there variation in the population? • Yes, there were resistant and non-resistant strains • Was this variation heritable? • Yes, the researchers showed that the phenotypes of the two strains were due to variation in their genotypes • Did natural selection occur? • Yes, only a small fraction of the M. tuberculosis cells survived the first round of antibiotics • When selection occurred, did a non-random subset of the population survive better and reproduce more? • It is clear that cells with the mutant allele conferring antibiotic resistance increased through time
Figure 21.7 a,b In tundra habitats above timberline, the alpine skypilot is pollinated primarily by bumblebees. 28 24 20 16 12 8 4 0 Number of individuals 10 12 14 16 18 20 22 Tundra flower: big and sweet-smelling Flower size (mm) In forested habitats below timberline, the alpine skypilot is pollinated primarily by flies. 10 8 6 Number of individuals 4 2 0 10 12 14 16 18 20 22 Below-timberline flower: small and skunky-smelling Flower size (mm)
Figure 21.7a In tundra habitats above timberline, the alpine skypilot ispollinated primarily by bumblebees. 28 24 20 16 12 8 4 0 Number of individuals 10 12 14 16 18 20 22 Tundra flower: big and sweet-smelling Tundra pollinator: bumblebee Flower size (mm)
Figure 21.7b In forested habitats below timberline, the alpine skypilot ispollinated primarily by flies. 10 8 6 Number of individuals 4 2 0 10 12 14 16 18 20 22 Below-timberline pollinator: fly Below-timberline flower: small and skunky-smelling Flower size (mm)
Figure 21.8 110 100 80 60 Bee visits received 40 20 0 –3 –2 –1 0 1 2 –4 Size score Small flowers Large flowers Short stems Tall stems
Figure 21.9 1.0 0.8 0.6 Relative fitness (fecundity) 0.4 0.2 0 40 60 0 20 80 100 110 Bee visits received
Figure 21.10 18 16 14 Offspring’s flower size (mm) 12 10 8 8 10 12 14 16 18 Mother’s flower size (mm)
Figure 21.11 POLLINATION EXPERIMENT: CONTROL GROUP 16 12 8 Number of individuals 4 0 9 11 13 15 17 3. Plant seedlings into randomly assigned locations in the field. Flower size (mm) 1. Hand pollinate a large, random sample of skypilots. 2. Collect seeds; germinate in greenhouse 4. Measure flower sizes and plot data. Average = 13.1 mm POLLINATION EXPERIMENT: EXPERIMENTAL GROUP 16 12 8 4 Number of individuals 0 9 11 13 15 17 3. Plant seedlings into randomly assigned locations in the field. Flower size (mm) 1. Allow bees to pollinate a large sample of skypilots. 2. Collect seeds; germinate in greenhouse 4. Measure flower sizes and plot data. Average = 14.4 mm
Box 21.2 Figure 1a Analogy: When similarities result from convergent evolution 1m 1m Ichthyosaur Common dolphin Whales and dolphins Monotremes Ichthyosaurs Pterosaurs Elephants Marsupials Synapsids Dinosaurs Primates Rodents Lizards Birds The members of lineages between the dolphins and ichthyosaurs do not have adaptions like: - streamlined bodies - long jaws filled with teeth - fins and flippers The dolphin and ichthyosaur lineages are far apart on the evolutionary tree, suggesting that they are not closely related
Box 21.2 Figure 1b Homology: When similarities are inherited from a common ancestor Fruit fly HOM complex Human Hox complex abdAabdB lab pb Dfd Antp b-1 b-2 b-3 b-4 b-5 b-6 b-7 b-8 b-9 Ubx Molluscs (snails, clams, squid) Echinoderms (sea stars, sand dollars) Chordates (vertebrates) Arthropods (insects, spiders, crustaceans) Annelids (segmented worms) Flatworms As shown in the two boxes above, the loci found in the Hox and HOM complexes of fruit flies and humans have similar sequences and are in the same order on their chromosomes