Download
1 / 16
160 likes | 241 Views
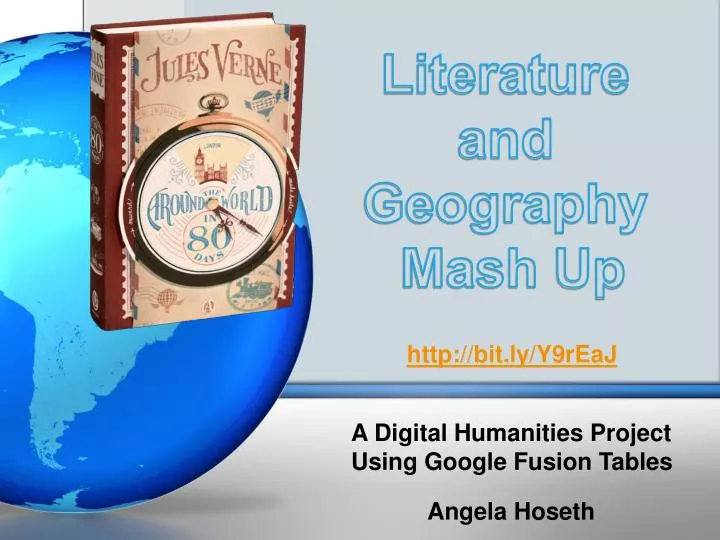
Literature and Geography Mash Up. http://bit.ly/Y9rEaJ. A Digital Humanities Project Using Google Fusion Tables. Angela Hoseth.

E N D
Literature and Geography Mash Up http://bit.ly/Y9rEaJ A Digital Humanities Project Using Google Fusion Tables Angela Hoseth
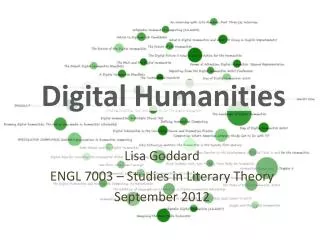
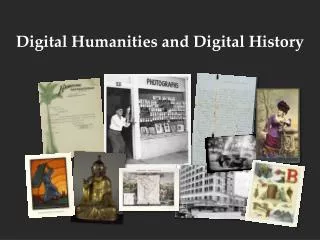
At its simplest, DH is the utilization of computers and computational tools for the exploration, analysis, and production of humanistic knowledge. —Jennifer Guiliano, MITH How do you define Digital Humanities?!
Before We Teach, We Tinker Constance Crompton March 22, 2013 http://bit.ly/udel_DH
Tinkering implies play and a lack of expertise or formal training. The process of Tinkering: toying with objects that already exist, not designing or building them from scratch.
What is digital humanities? Will it add value to my curriculum? I don’t have time to master Web 2.0 Tools! You want us to read another book? Reading is so boring!
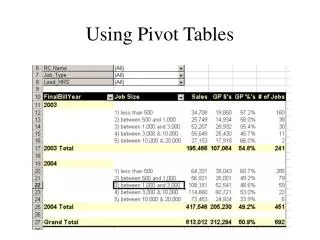
Google Fusion Tables: Visualize your data online
Google Fusion Tables: Visualize your data online Fusion Tables is a free online service from Google that helps people gather, visualize, and share large data tables. • Filter and summarize hundreds of thousands of rows. • Merge tables to generate a single visualization • Make charts, maps, or network graphs in minutes • Publish your visualization online or send in email • Others can produce charts or maps from it • Anytime, anyplace collaboration: All your data organization is automatically saved and stored in Google Drive
Google Fusion Tables: Where do I get the data? • Import your own data • Find public data: Google Tablessearches for thousands of public Fusion Tables, or millions of public tables • Combine public data sets with your own • Set share permissions to keep some data private • Specify attribution for the data, so your attribution will appear if you data is merged into other tables
Mapping Project Using Google Fusion Tables • by • Constance Crompton, University of British Columbia • Constance generously provided free and open access to her data sets, text, tutorials, powerpoint presentations and web resources. • To keep it simple we will use her data. . • Open the verne_80_days.xslx spreadsheet. • Examine the data • What is in the first row? • What type of file are the links the “Image” row pointing to? • What do you think is the significance of the “Text” and “Chapter” rows? • What are the links the “Chapter_link” row pointing to? What is the # in the last segment for?
Mapping Project Using Google Fusion Tables • Step-by-step instructions from: • Constance Crompton, University of British Columbia • Log into your personal Google site • In Google Drive select Create> Fusion Table (experimental). Select “From this computer,” hit browse and select the verne_80_days.xslx file. • Hit “Next.” Check that the “Column names are in row” is correct. Check that all the data in your spreadsheet was imported. • Hit “Next” • Click on the “Map of City” tab – and let Google load the place names. • Ta-da! Now you have a Visualization of your text
Now have a look at the open spread sheet on your computer • have a look at the pop-ups on your map. • Do you see the correlation between the data on the spreadsheet and the content of the spreadsheet? • So the pop-up window content isn’t very attractive. Let’s remove some redundant content • Click on Tools> Change window info layout…> Automatic. Uncheck the box beside modern_name. • Think back to the pop-up window and have a look at the line you just unselected: • <b>Modern_name:</b> {Modern_name}<br> • What is the code you just unselected doing? Try turning it on and off a few times.
So now we can turn lines of code on and off, but we’d rather control the layout and add our own text. • Open Tools> Change window info layout…> Custom • Code! You will recognize each line from the “Automatic” tab • Let’s take a moment and unpack what we are seeing here. • Encoding uses tags to add more structure • What does it look as though the {} are doing? • and now we TINKER!
TINKERING • Go element hunting • What about those floating <br/>s? Find out what they do by removing a whole <br/> = <br></br> tag from your code, saving, and having a look at your popup window. • Find out what the <b> tags stand for by removing an opening b tag and a its closing b tag from your code, saving, and having a look at your popup window. • Try adding some text to your popup windows • Try rearranging the order of the elements and calls to your spreadsheet (which are the column names in {} brackets). • Try to puzzle out what is happening in the element marked by <a> tags.
TINKER EVEN MORE • Try to reproduce or improve on the popup windows at http://bit.ly/80daysmap • Publish(hint: it’s in one of the dropdown menus) • Experience Bonus: Google Fusion Tables are actually meant to help you mash up data. Take the tour at http://support.google.com/fusiontables/answer/184641/ • Experience Bonus: Fusion Tables aren’t solely for mapmaking. Students can use Fusion Tables can use them to create a visualization, chart, or table.
Fusion Tables: Visualize your data online Learning Environment and Theories Emerging Technologies for the Classroom: A Learning Sciences Perspective by ChrystallaMouza and Nancy Lavigne, 2012 Environment Theories eTextbook • Networked technology • Visual results • Easy global collaboration • Need a computer, won’t work on mobile devices • Dynamic-Representation • Very easy: Middle School and beyond • Free • Ch. 8, E.A. Ezra • Ch. 7, Slotta & Najafi • Ch. 5, Gerard, et al. • Ch. 10, Mouza & Cavalier • Ch. 3, Roschelle et al. • Ch. 2, Vahey et al. • Ch. 7, Slotta & Najafi • Ch. 8, E.A. Ezra • Anytime, Anyplace • Collaborative learning • Inquiry activities using Visualization; • Engagement • Critical Thinking • Community Knowledge Base • Provides real world contexts
Would this project be useful for your courses? How would you tinker with it to adapt it to your curriculum?